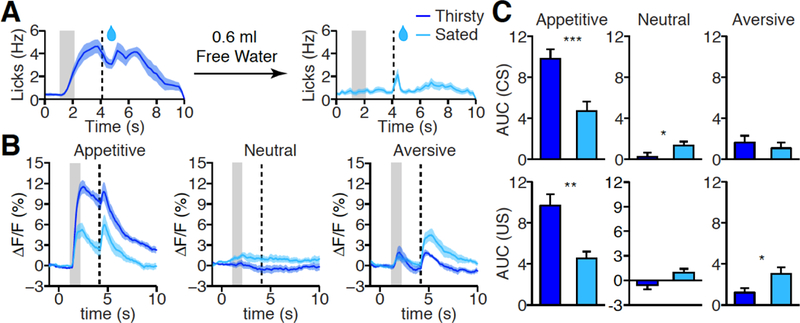
Fig. 4. Effect of homeostatic state on PVT responses.

(A) Mean lick rate after odor cue in thirsty (left, dark blue, n = 7) and sated (right, light blue, n = 7) state. (B, C) Mean photometric traces (B) and quantification (C) of PVT responses in appetitive (left), neutral (middle), and aversive (right) test in thirsty (left, dark blue) and sated (right, light blue) state. CS (top) and US (bottom) response in C. Thirsty: n= 7; Sated: n = 7; *P < 0.05, **P < 0.01, ***P < 0.001 (Mann-Whitney U-test). Shade, SEM across mice in A, B. Gray bar: 1s of CS delivery, vertical dash line: US delivery in A, B. Data are means ± SEM.
