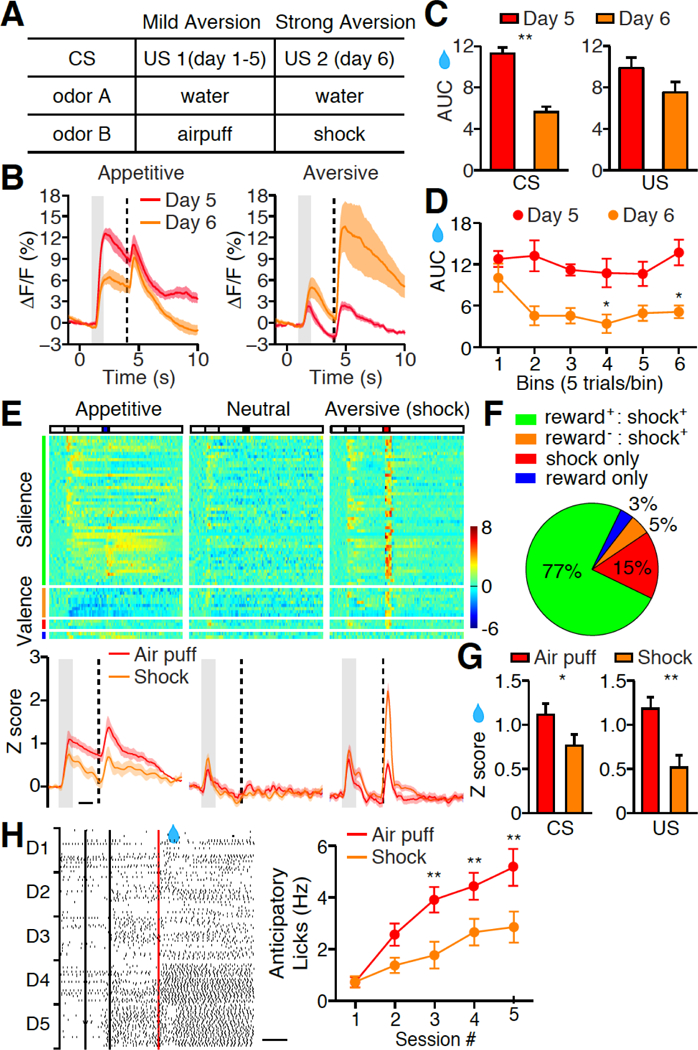
Fig. 5. Context-dependent modulation of salience response in the PVT.

(A) Behavioral procedure for switching from mild to strong aversive context. (B) Mean photometric responses of the PVT to appetitive and aversive test in mild (n = 6) versus strong aversive context (n = 6). (C) Quantification of CS (left) and US (right) response in B. Mann-Whitney U-test, **P < 0.01 (CS); P = 0.15 (US). (D) Rapid suppression of PVT response to water predicting cue after switching from mild to strong aversive context. Note no further reduction observed after 10 trials. (E) Top, Z score heat maps for all task-responding neurons identified by in vivo single unit recording of well-trained animals in strong aversive context. Neurons are separated in four subgroups based on their tuning properties, and are rank-ordered by their response onset times during reward cue stimulation. Each row in the heat maps represents responses from the same neuron to different stimuli. n = 62 neurons from 12 mice. Bottom, Z score quantification of PVT response during Pavlovian tasks. (F) Pie chart shows the tuning of PVT neurons in strong aversive context. (G) Z score quantification of CS (left) and US (right) response in the PVT during appetitive test in mild (n = 85 neurons) versus strong aversive context (n = 62 neurons). Mann-Whitney U-test, *P < 0.05 (CS); **P < 0.01 (US). (H) Left, raster plots illustrate licking behavior across 5 reward conditioning sessions in strong aversive context. . Right, quantification of anticipatory licks during reward conditioning in mild (red, n = 7) versus strong aversive context (orange, n = 7). **P < 0.01, (Two-way ANOVA, Post-hoc Bonferroni test). Red, mild aversive condition; Orange, strong aversive condition, in E, G, H. Shade, SEM across mice in B, E. Gray bar: 1s of CS delivery, vertical dash line: US delivery in B, E. Scale bar: 1s in E, H. Data are means ± SEM.
