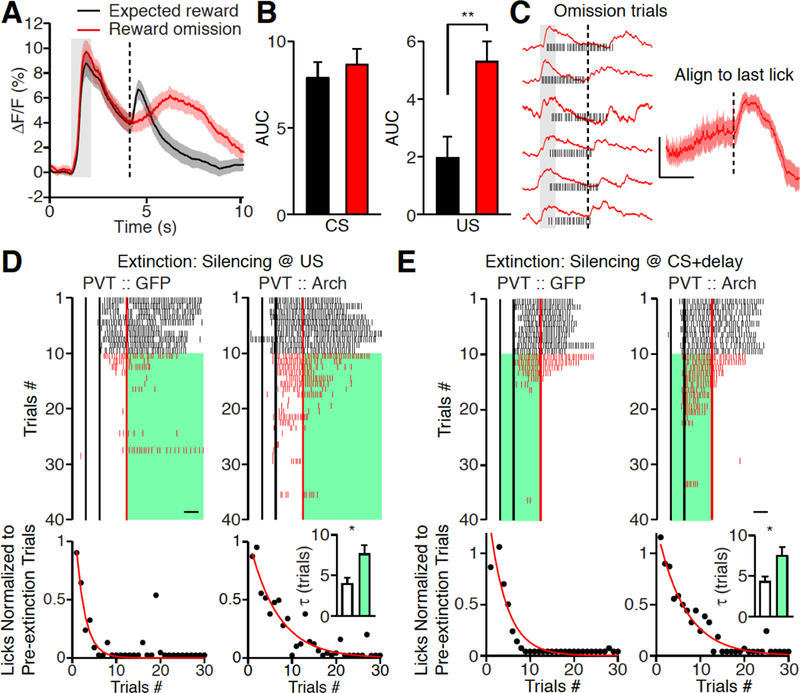
Fig. 6. Reward omission response in the PVT.

(A, B) Mean photometric traces (A) and histogram (B) illustrating delayed but long lasting PVT responses to reward omission. Expected reward (black, n = 10); Reward omission (red, n = 10), Wilcoxon signed-rank test, P = 0.19 (CS); **P < 0.01 (US). (C) Left, representative traces of individual omission response (red) superimposed with lick raster plots (black). Right, mean photometric traces (n = 10) after aligning to the last lick in omission trials. Note the rapid increase of calcium signals after licking stops. Scale Bar, 2% ΔF/F, 1s. Gray bar: CS delivery, vertical dash line: US delivery in A, C. (D, E) Top, representative lick raster plots from PVT :: GFP (left) and PVT :: ArchT mice (right) with laser stimulation during reward omission period (D) or CS + delay period (E) of extinction trials. Back lines indicate the start and end time for odor delivery, respectively. Red line indicates water delivery. Scale bar: 1s. The mice received water reward in first 10 trials (black), then water delivery stopped (red) and optogenetic stimulation was on until the end of the trial (green). Bottom: quantification of anticipatory licks in 30 extinction trials. Licks (black dot) are normalized to averaged licks during the first 10 trials. Red line indicates the exponential fit of licks. D: Inset, histogram shows the mean time constants (τ) of extinction from PVT :: GFP (white, n = 6) and PVT :: ArchT (green, n = 10) mice. E: Inset, histogram shows the mean time constants (τ) of extinction from PVT :: GFP (white, n = 9) and PVT :: ArchT (green, n = 10) mice. Mann-Whitney U-test, *P < 0.05. Shade, SEM across mice in A, C. Data are means ± SEM.
