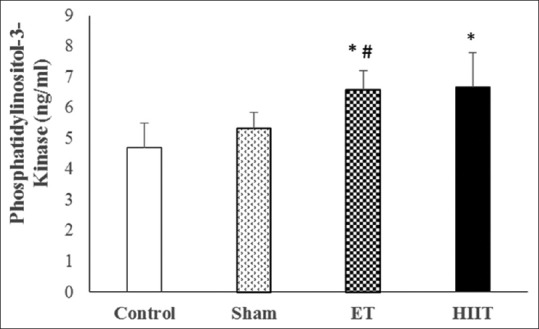
Figure 1.

Changes of phosphatidylinositol-3-kinase concentration in trained (high-intensity interval training and endurance training) and untrained (Sham and Control) rats (values are means ± standard deviation). *P ≤ 0.001 compared with Control group; #P ≤ 0.05 compared with sham group
