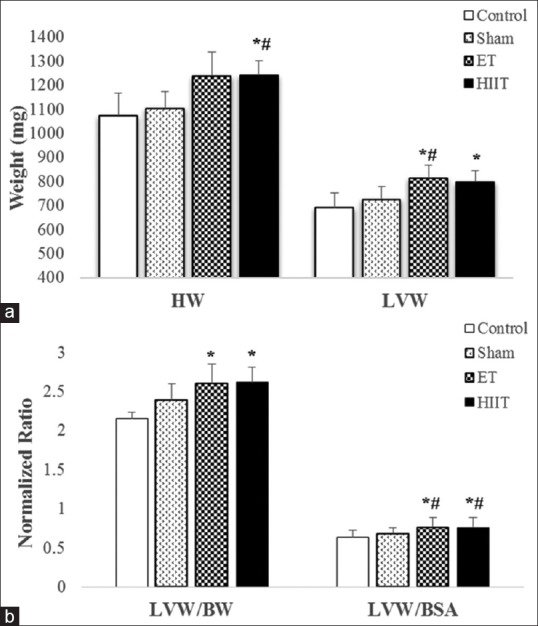
Figure 3.

(a) Heart weight and left ventricle weight of rats in high-intensity interval training, endurance training, Sham or Control groups; (b) left ventricle weight to body weight ratio and left ventricle weight to body surface area ratio of rats in high intensity interval training, endurance training, Sham and Control groups (values are means ± standard deviation). *P ≤ 0.05 compared with Control group; #P ≤ 0.05 compared with sham group
