FIGURE 7.

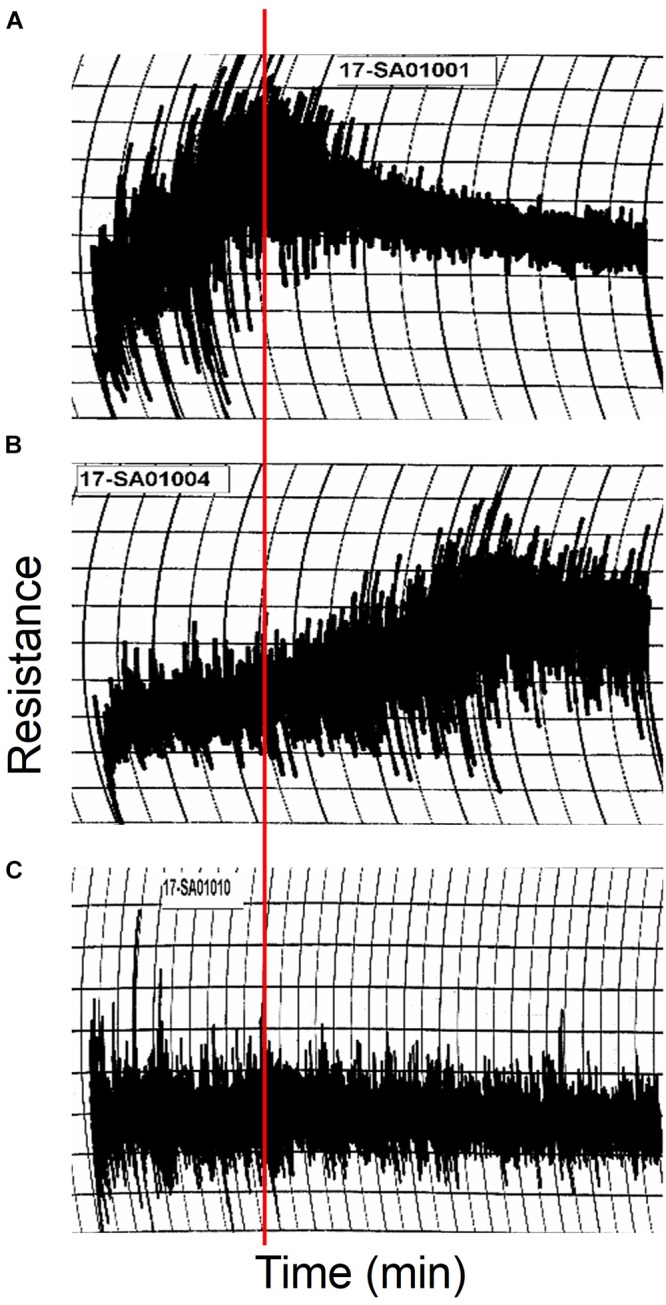
10 g mixogram curves produced using flour from non-transgenic (A) and transgenic lines 118a-5 (B) and 118b-3 (C). The red line shows the position of the peak mixing time in the non-transgenic.

10 g mixogram curves produced using flour from non-transgenic (A) and transgenic lines 118a-5 (B) and 118b-3 (C). The red line shows the position of the peak mixing time in the non-transgenic.