
Figure 7.
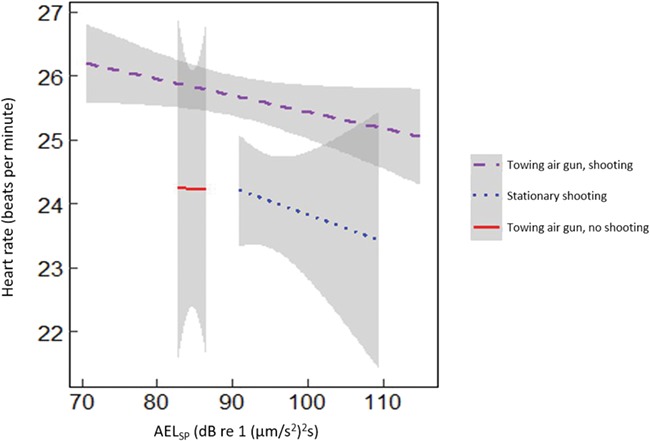
Changes in cod (n = 20) heart rate during three types of sound exposure. The grey areas indicate the 95% confidence interval of the linear model.
Official websites use .gov
A
.gov website belongs to an official
government organization in the United States.
Secure .gov websites use HTTPS
A lock (
) or https:// means you've safely
connected to the .gov website. Share sensitive
information only on official, secure websites.
Changes in cod (n = 20) heart rate during three types of sound exposure. The grey areas indicate the 95% confidence interval of the linear model.