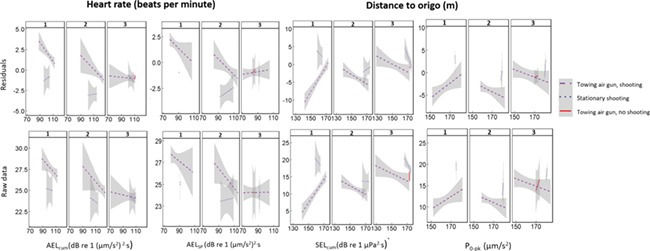
Figure 8.

Significant (P < 0.05) temperature detrended (top row) and raw (bottom row) responses of cod (n = 8) to sound exposures (x-axis) identified using random forest analysis and linear mixed effect models. Significant variables were tested against temperature detrended data to determine whether the trend was driven by sound or was an artefact of temperature. Numbers 1–3 indicate the day number of sound exposure.
