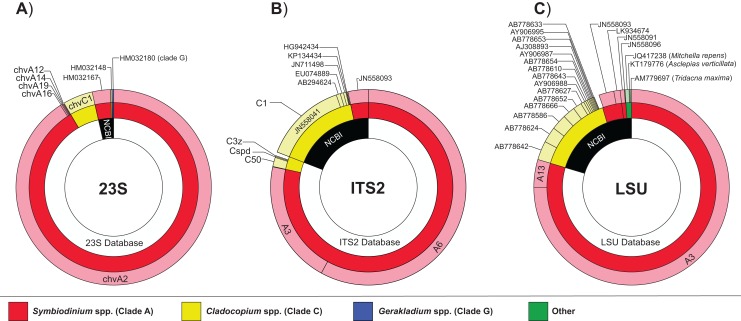
Figure 2. Proportion and diversity of Symbiodiniaceae genotypes across markers.
Global Symbiodiniaceae diversity charts obtained from each of the three datasets: (A) 23S, (B) ITS2, and (C) LSU. The proportion of sequences matching one of the three in-house reference databases or NCBI (inner circles) and their corresponding phylogenetic affiliation at genus (i.e., clade; middle circles) and sub-generic (i.e., subclade; outer circles) levels. Sequence reads representing <0.1% of total read abundance are not included.

