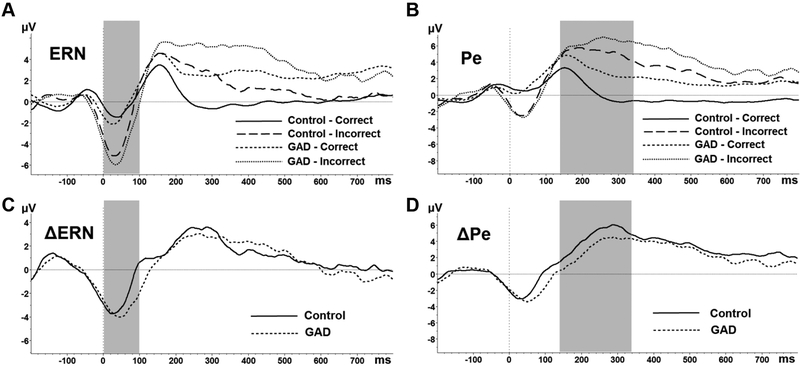
Figure 4.
ERN (left) and Pe (right) waveforms are depicted separately by group (GAD; Control) and correct/incorrect responses (A; B). ΔERN and ΔPe difference waveforms are presented separately by group (C; D). Sections B and D represent significant group differences in Pe such that (B) individuals with GAD had significantly larger Pe amplitudes on correct responses compared to Controls and (D) the Pe difference between incorrect and correct responses was significantly smaller in the GAD group relative to Controls.

