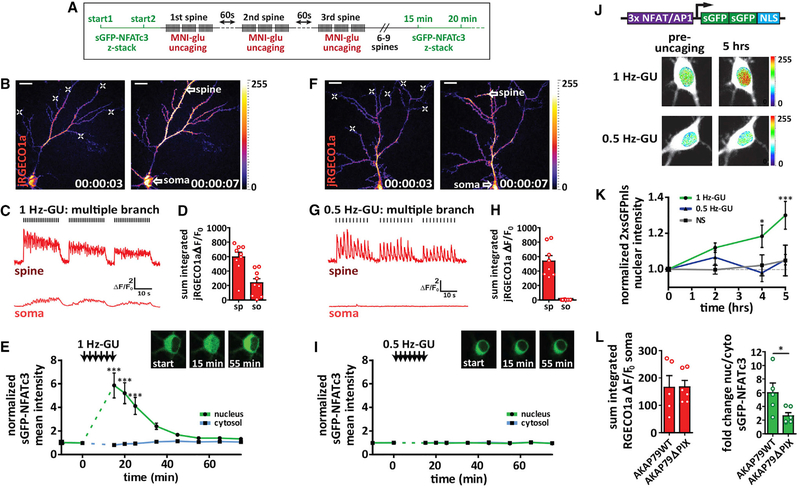
Figure 1. Ca2+ Signal Propagation to the Soma Is Required for NFAT Translocation.
(A) Schematic for multiple spine stimulation.
(B) Neuron transfected with sGFP-NFATc3 and jRGECO1a (pseudocolored). Left: pre-uncaging. Right: during a 1 Hz glutamate uncaging. White crosses indicate sites of 1 Hz-GU. Scale bar, 20 μm.
(C) jRGECO1a ΔF/F0 traces from ROIs drawn for a dendritic spine and the soma as indicated by white arrow spines in (B).
(D) Sum integrated ΔF/F0 for spine (sp) and soma (so) following 1 Hz-GU.
(E) sGFP-NFATc3 nuclear and cytosolic intensity normalized to pre-uncaging values. Inset: images of soma for neuron in (B) with sGFP-NFATc3 distribution pre(start) and post-uncaging as indicated (n = 9; one-way ANOVA repeated-measures with Dunnett, ***p < 0.001).
(F) Multi-spine stimulation and jRGECO1a Ca2+ imaging as described in (B) but for 0.5 Hz-GU.
(G) Representative ΔF/F0 Ca2+ traces as described in (C) but for 0.5 Hz-GU.
(H) Integrated ΔF/F0 Ca2+ measurements as described in (D) but for 0.5 Hz-GU.
(I) sGFP-NFATc3 nuclear and cytosolic intensity measurements as described in (E) but for 0.5 Hz-GU (n = 8).
(J) Top: diagram of 3xNFAT-2xsGFPnls transcriptional reporter construct. Bottom: images of neuronal soma pre-uncaging and 5 h after uncaging with either 1 Hz-GU or 0.5 Hz-GU. Neurons transfected with the 3xNFAT/AP1–2xsGFPnls reporter (pseudocolored) and jRGECO1a (shown in white).
(K) Graph of 2xsGFPnls nuclear intensity (normalized to pre-uncaging values) for nonstimulated (NS, n = 5) and either 0.5 Hz-GU (n = 6) or 1Hz-GU (n = 5) on 7 different branches (one-way ANOVA repeated-measures with Dunnett, ***p < 0.001, *p < 0.05).
(L) Left: sum integrated somatic ΔF/F0 following distal 1 Hz-GU across 3 spines (MBs) with AKAP150-shRNAi and rescue with AKAP79WT (n = 5) or AKAP79ΔPIX (n = 6). Right: peak fold change in sGFP-NFATc3 nucleus/cytosol ratio following uncaging protocol described (unpaired t test, *p < 0.05).
See also Figure S1.

