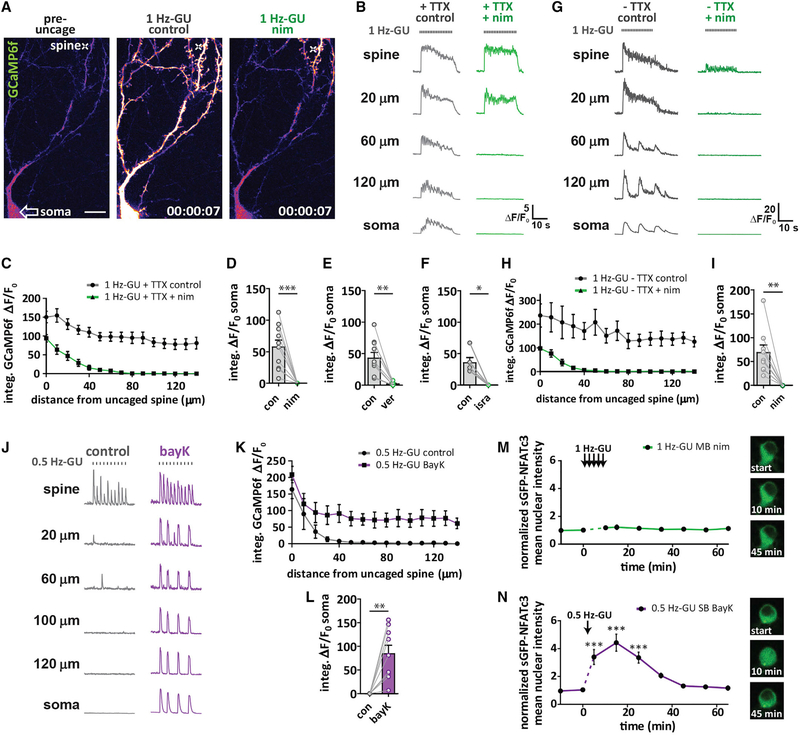
Figure 2. LTCCs Are Required for Ca2+ Signal Propagation to the Soma and Are Activated Preferentially by Higher Intensity Distal Spine Stimulation.
(A) Neuron transfected with mCh and GCaMP6f (pseudocolored). Cross indicates location of uncaging. Left: pre-uncaging in control. Middle: 2 s after start of 1 Hz-GU (20 pulses) in control. Right: 2 s after start of 1 Hz-GU following 10 min incubation in nim (10 μM). Scale bar, 20 μm.
(B) Representative GCaMP6f ΔF/F0 traces after distal 1 Hz-GU in control and after addition of nim, with TTX (1 μM) in the bath. Measurements were made at uncaged spine and at intervals along the dendrite to the soma as indicated.
(C) Integrated GCaMP6f ΔF/F0 for ROIs along the dendrite every 10 μm from uncaged spine toward the soma for experiments described in (B) (n = 11).
(D) Somatic integrated GCaMP6f ΔF/F0 from ROI drawn on soma before and after nim (n = 11; paired t test, ***p < 0.001).
(E) As (D) but with verapamil (25 μM; n = 10; paired t test, **p < 0.01).
(F) As (D) but with isradipine (5 μM; n = 5; paired t test, *p < 0.05).
(G) Representative GCaMP6f ΔF/F0 traces following 1 Hz-GU in control and nim without TTX in the bath.
(H) Integrated GCaMP6f ΔF/F0 for experiments described in (G) (n = 9).
(I) Somatic integrated GCaMP6f ΔF/F0 before and after nim with no TTX (n = 9; paired t test, paired t test, **p < 0.01).
(J) Representative GCaMP6f ΔF/F0 traces following 0.5 Hz-GU in control and after addition of BayK (5 μM).
(K) Integrated GCaMP6f ΔF/F0 along the dendrite for experiments described in (J) (n = 9).
(L) Somatic integrated GCaMP6f ΔF/F0 before and after BayK (n = 9; paired t test, **p < 0.01).
(M) Graph of sGFP-NFATc3 nuclear intensity following 1 Hz-GU trains (60 pulses) at 6 spines on separate branches with nim (5 μM) in bath (n = 7). Inset: representative image of soma with sGFP-NFATc3 distribution before (start) and after uncaging as indicated.
(N) Graph of sGFP-NFATc3 nuclear intensity following a 0.5 Hz-GU (30 pulses) at 1 spine with BayK in the bath (n = 4). Inset: representative image of soma with sGFP-NFATc3 distribution before (start) and after uncaging as indicated (one-way ANOVA repeated-measures with Dunnett, ***p < 0.001).
See also Figure S2.

