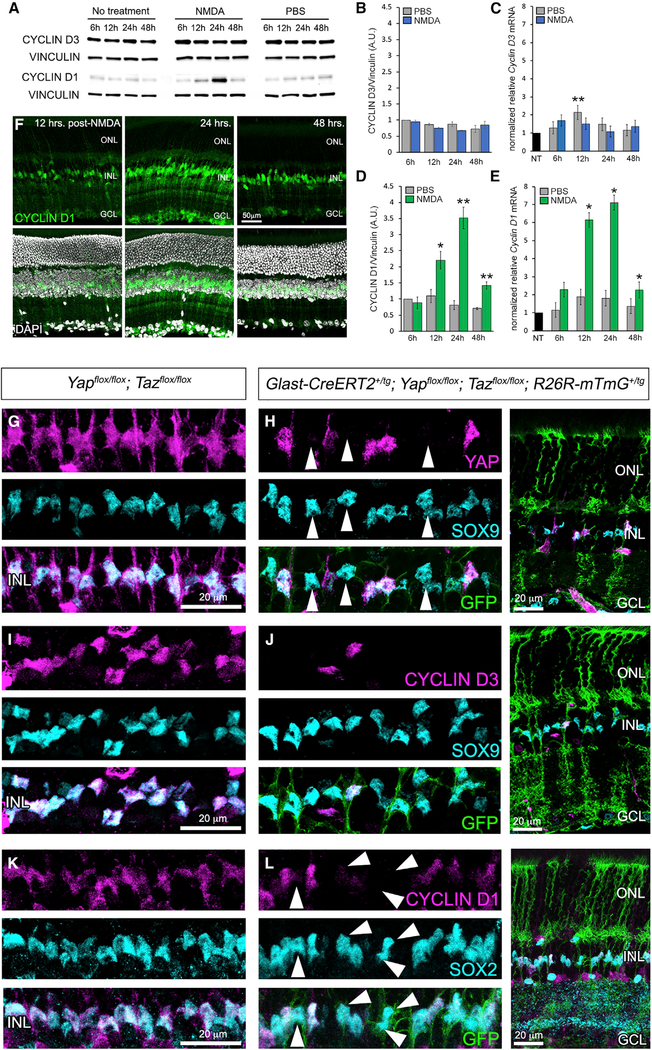
Figure 2. CYCLIN D3 and Cyclin D1 Expression in Response to Retinal Injury and CKO of Yap and Taz.
(A) CYCLIN D1 and CYCLIN D3 western blot time course of NMDA-damaged retinae.
(B and C) Quantification of CYCLIN D3 western blots (B) and qRT-PCR (C) analysis of mRNA.
(D and E) Quantification of CYCLIN D1 western blots (D) and qRT-PCR (E) analysis of mRNA.
(F) CYCLIN D1 immunofluorescence 12, 24, and 48 h post-injury.
(G and H) YAP (magenta) and SOX9 (cyan) immunofluorescence on control (G) and CKO MGs (H) (labeled with GFP from the ROSE26R-mTmG Cre reporter).
(I and J) CYCLIN D3 (magenta) and SOX9 (cyan) immunofluorescence on control (I) and CKO MGs (J).
(K and L) CYCLIN D1 (magenta) and SOX2 (cyan) immunofluorescence on control (K) and CKO MGs (L).
For western blots, levels are given as a.u. ± SEM relative to the 6-h post-injection PBS control (set to 1) (n = 3 independent pooled samples per group; Student’s t test). For qRT-PCR, mRNA levels are relative to the no-treatment (NT) control (set to 1) and depicted as fold change ± SEM (n = 3 independent pooled samples per group; Student’s t test). *p ≤ 0.05, **p ≤ 0.01.

