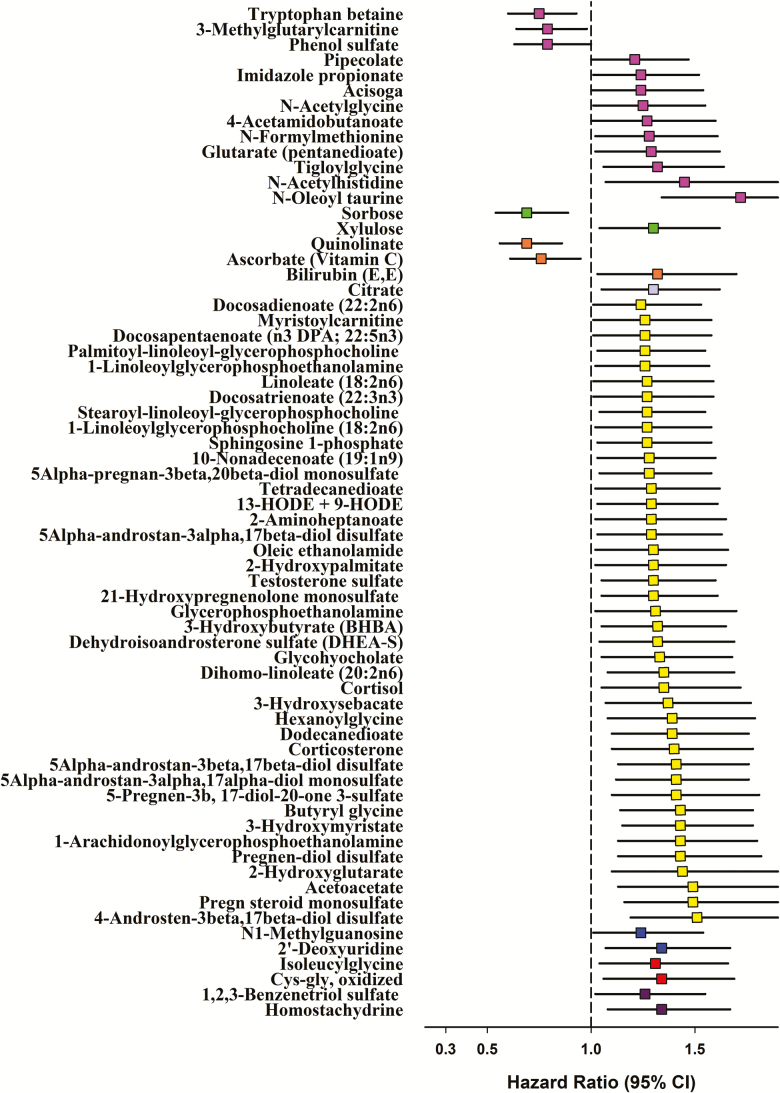
Figure 1.
Hazard ratios (HRs) for prostate cancer-specific mortality by prediagnostic serum metabolites (per 1 SD) at p-value < .05. The serum metabolites were natural log-transformed and standardized (mean = 0, variance = 1). We used attained time as the time metric in the Cox proportional hazard regression models that were adjusted for age at diagnosis (years, continuous), tumor stage at diagnosis (cancer stage I–IV), and year of diagnosis (1986–1994, 1995–2000, 2001–2007). N-oleoyl taurine was statistically significantly associated with prostate cancer-specific mortality, with p-value (p = .000017) being lower than the predefined statistical threshold after Bonferroni correction (p = .00008, 0.05/625). Colors indicate chemical classes: Amino acids = light purple; carbohydrates = green; cofactors and vitamins = orange; energy metabolites = lavender; lipids = yellow; nucleotides = blue; peptides = red; xenobiotics = dark purple.

