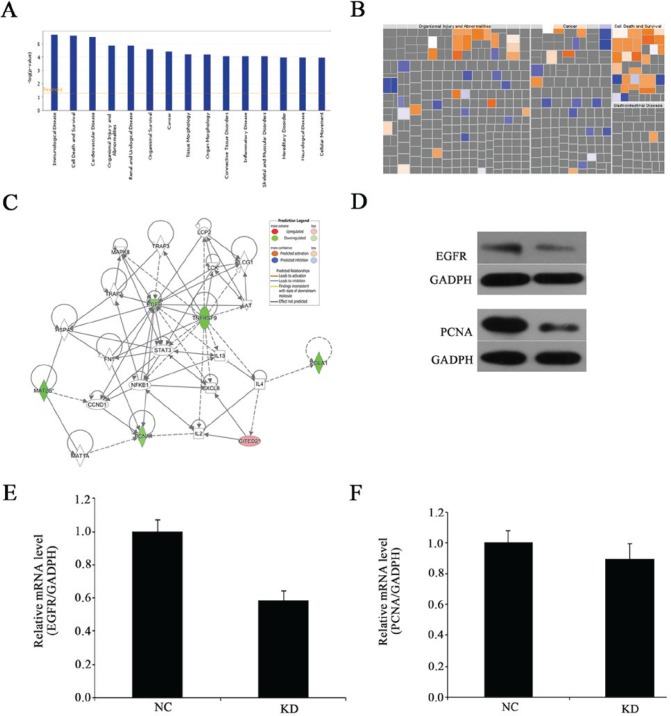
Figure 7.
Gene expression profiling identified an association between alterations in MAT2B expression. (A) Disease and functional analysis classified gene enrichment following MAT2B silencing. (B) Heat map of the disease and functional analysis identified the genes enriched following MAT2B silencing. Orange ones indicate activated functions and blue ones indicate suppressed functions. (C) Knowledge-based interaction network following MAT2B silencing in MNNG/HOS cells. The network was built based on the interaction of the Ingenuity Pathway Analysis database overlaid with microarray data from MAT2B-KD cells with a 2-fold change cut-off. The intensity of the node color indicates the degree of up-(red) or down-(green) regulation following MAT2B knockdown in MNNG/HOS cells. Solid arrows in the figure indicate confirmed regulatory relationships and dotted lines indicate predicted regulatory relationships. (D) Protein expression levels of EGFR and PCNA were detected by western blotting. (E) EGFR mRNA expression level was detected by RT-qPCR following MAT2B knockdown in MNNG/HOS cells. (F) PCNA mRNA expression level was detected by RT-qPCR following MAT2B knockdown in MNNG/HOS cells. MAT2B, methionine adenosyltransferase 2B; KD, knockdown; EGFR, epidermal growth factor receptor; PCNA, proliferating cell nuclear antigen; RT-qPCR, reverse transcription-quantitative polymerase chain reaction

