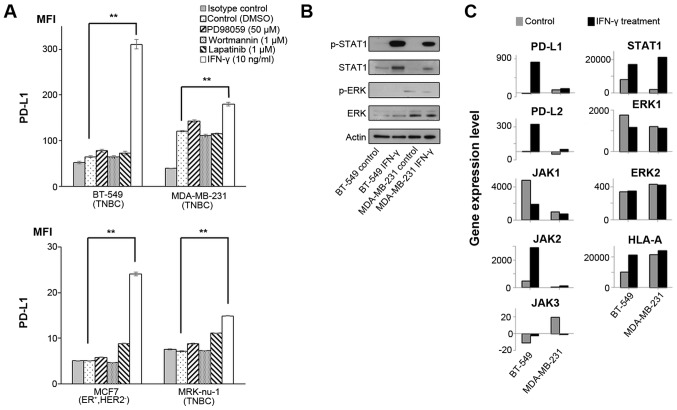
Figure 1.
Effects of IFN-γ on PD-L1 and signaling pathways. (A) PD-L1 expression was measured by flow cytometry in the cell lines at 48 h following treatment with DMSO, which was used as a vehicle control, 50 µM PD98059 (MAPK inhibitor), 1 µM wortmannin (PI3K-AKT inhibitor), 1 µM lapatinib (combined epidermal growth factor receptor/human epidermal growth factor receptor 2 tyrosine kinase inhibitor), and 10 ng/ml IFN-γ. Error bars represent the means ± SEM. **P<0.01 between the treated and control cells. (B) Western blot analysis against each protein in cell lines at 1 h following treatment without (control) or with 10 ng/ml IFN-γ. A representative result out of the 3 independent experiments is shown. (C) Relevant gene expression levels in cell lines treated without (control) or with 10 ng/ml IFN-γ. The y axes in all the bar graphs indicate the gene expression level. Gene expression levels were normalized to those of actin beta (ACTB), glyceraldehyde-3-phosphate dehydrogenase (GAPDH), peptidylprolyl isomerase A (PPIA) and hypoxanthine phosphoribosyltransferase 1 (HPRT1).

