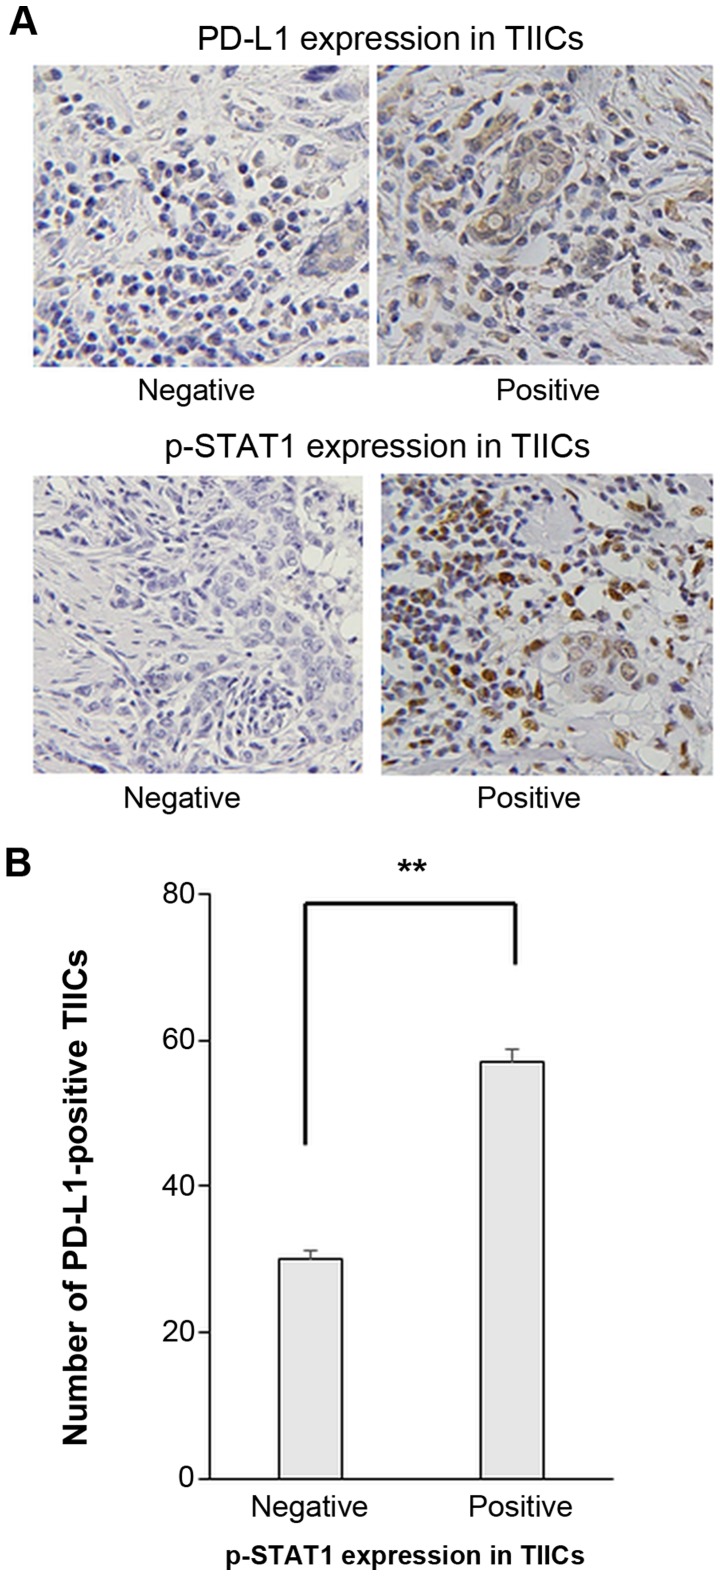
Figure 5.
Number of PD-L1 expressing TIICs was significantly increased in a group of p-STAT1-positive TIICs. (A) Representative immunohisto-chemical staining with p-STAT1 and PD-L1. Original magnification, ×400. (B) Associatoin between p-STAT1 and PD-L1 expression in TIICs. Student’s t-test was performed. Error bars represent the means ± SEM. **P<0.01 between the negative and positive groups of p-STAT1 expression in TIICs.

