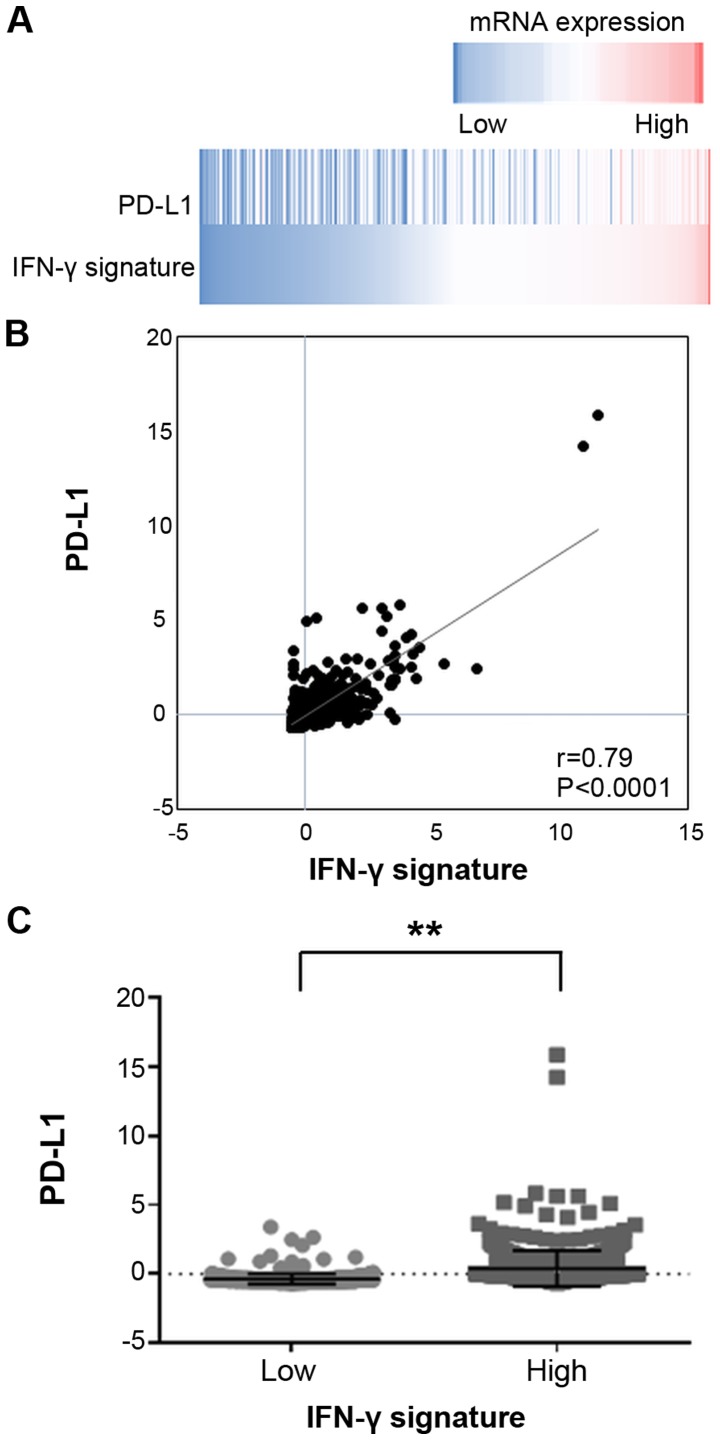
Figure 6.
mRNA expressions of PD-L1 and IFN-γ signature in breast invasive carcinoma tissues. (A) A heatmap showing mRNA expression levels of the PD-L1 and IFN-γ signature in breast invasive carcinoma tissues (TCGA dataset). (B) Correlation between PD-L1 and IFN-γ signature mRNA expression levels and PD-L1 expression with the median of the values of IFN-γ signature; those lesser than the median were determined to be low and those equal to or above the median were determined to be high (C). Error bars represent the means ± SEM. **P<0.01 between the high and low groups of the IFN-γ signature.

