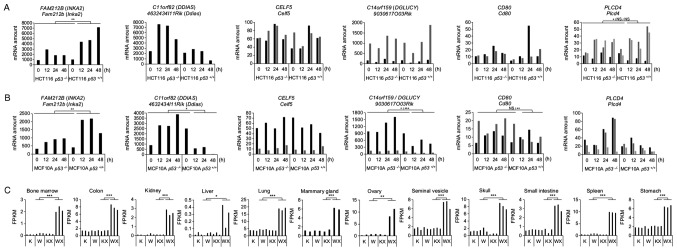
Figure 1.
Expression levels of candidate genes in mouse and human transcriptome data. (A and B) Expression levels of the 6 candidate gene mRNAs in human wild-type p53 (p53+/+) or knockout (p53−/−) (A) HCT116 colorectal carcinoma cells and (B) non-tumourigenic breast epithelial cells MCF10A harvested at 0, 12, 24 or 48 h following treatment with ADR. Cells were treated with 2 and 0.5 μg/ml of ADR for 2 h for the HCT116 and MCF10A cells, respectively. Different isoforms are represented by bars of different shades of grey and black. P-values were calculated between p53+/+ cells 12, 24, 48 h and the group comprising p53−/− cells 0, 12, 24, 48 h and p53+/+ cells 0 h using one-way ANOVA ; *P<0.05, **P<0.01 and ***P<0.001; NS, not statistically significant. (C) Levels of the Inka2 mRNA in the mouse tissues satisfying the screening criteria. RNA-seq was performed on tissues from untreated p53 wild-type (W) or knockout (K) mice, or on those dissected 24 h following irradiation with 10 Gy of X-rays (WX and KX). The expression levels are represented in fragments per kilobase million (FPKM). P-values were calculated between the WX group and the group with a maximum median expression among the W, K and KX groups by one-way ANOVA with Dunnett’s post hoc test; *P<0.05, **P<0.01 and ***P<0.001. ADR, adriamycin; Inka2, inka box actin regulator 2.

