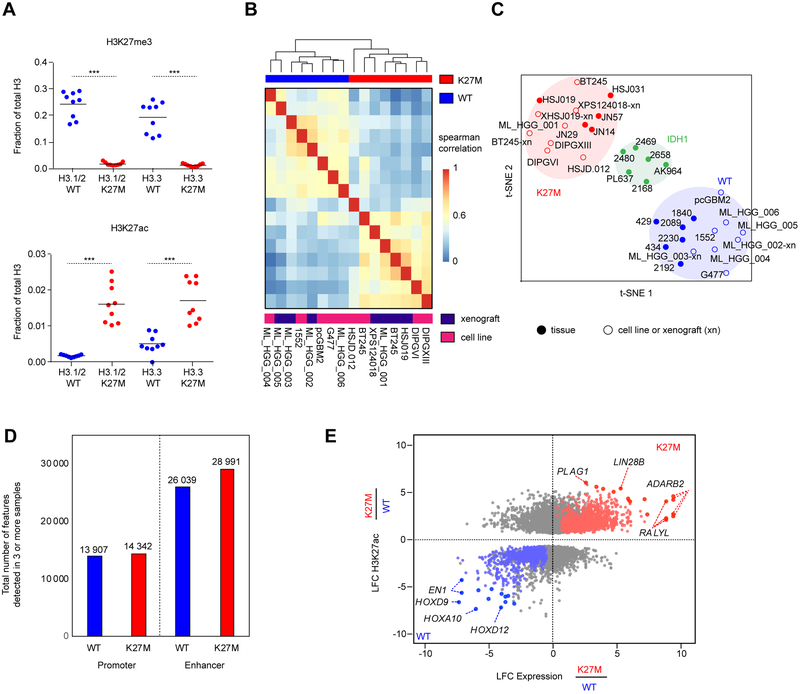
Figure 1. Active regulatory chromatin landscape of pediatric HGG.
(A) Quantification of H3K27me3 (top panel) levels and H3K27ac (bottom panel), abundance by mass spectrometry in H3.3-K27M HGG lines compared to WT lines (n=9; 3 technical replicates of 3 cell lines). Solid horizontal line indicates mean. Two-sided Wilcoxon-Rank Sum Test, ***p<0.001
(B) Unsupervised hierarchical clustering of pair-wise Spearman correlations performed between cell K27M and WT culture models based on read density within H3K27ac loci.
(C) t-SNE analysis on HGG cell lines, xenografts (denoted with the suffix -xn), and primary tissues using distinct H3K27ac loci between K27M and WT identified in cell lines.
(D) Number of H3K27ac positive enhancers and promoters detected in at least 3 samples out of either n=13 K27M or n=14 WT HGG samples shown in Figure 1C. Enhancers were defined by MACS1.4 peaks (p<1e-9) called greater than 2.5 kb upstream or downstream of the nearest TSS, and promoters defined by peaks within 2.5 kb.
(E) Identification of subgroup-specific genes with concordant changes in both expression and H3K27ac in patient-derived cell lines. X-axis: log2 fold-change (LFC) of gene expression between H3K27M (n=7 replicates) and H3K27WT (n=6 replicates) cell lines. Y-axis: LFC of H3K27ac at a promoter or enhancer associated with the gene. Genes with significantly differentially acetylated regulatory regions between H3K27M and H3K27WT lines are shown (p<0.05). Red: significantly upregulated in H3K27M. Blue: significantly upregulated in H3K27WT. Grey: no significant changes in expression. Filled circle: genes with the greatest magnitude of changes in both H3K27ac and expression. see also Figure s1 and Tables s1, s2, and s3.

