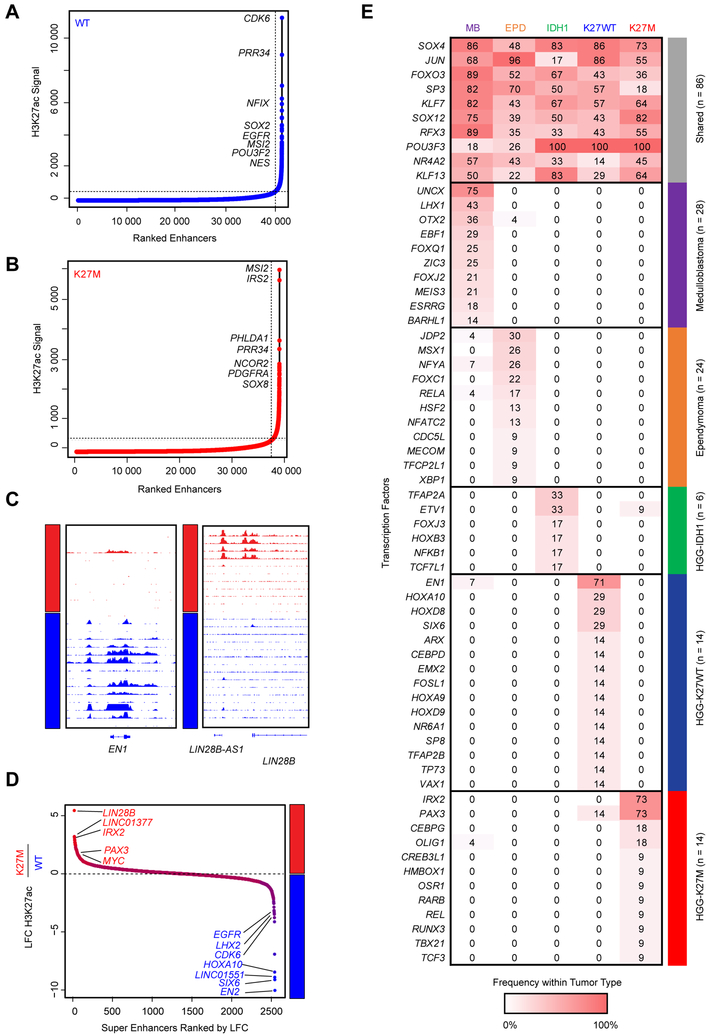
Figure 2. Core regulatory SE and TF programs delineate H3.3K27M and H3K27WT HGG.
(A-B) Super enhancers detected across all H3K27WT HGG samples (n=8) (A) and H3.3K27M HGG samples (n=8) (B) using the same samples listed in Figure 1B.
(C) Patterns of H3K27ac shown surrounding the EN1 locus (left panel) and LIN28B (right panel).
(D) Differential super enhancers restricted to H3K27WT and H3K27M samples as detected by DiffBind in DESeq2 mode.
(E) Core regulatory circuitry transcription factors shared or enriched in medulloblastoma, ependymoma, IDH1-glioma, H3K27WT (n=8) and H3K27M HGG (n=11) samples. Score indicates the number of core TFs detected within at least one core regulatory circuit in a given tumor type.
See also Table S4.

