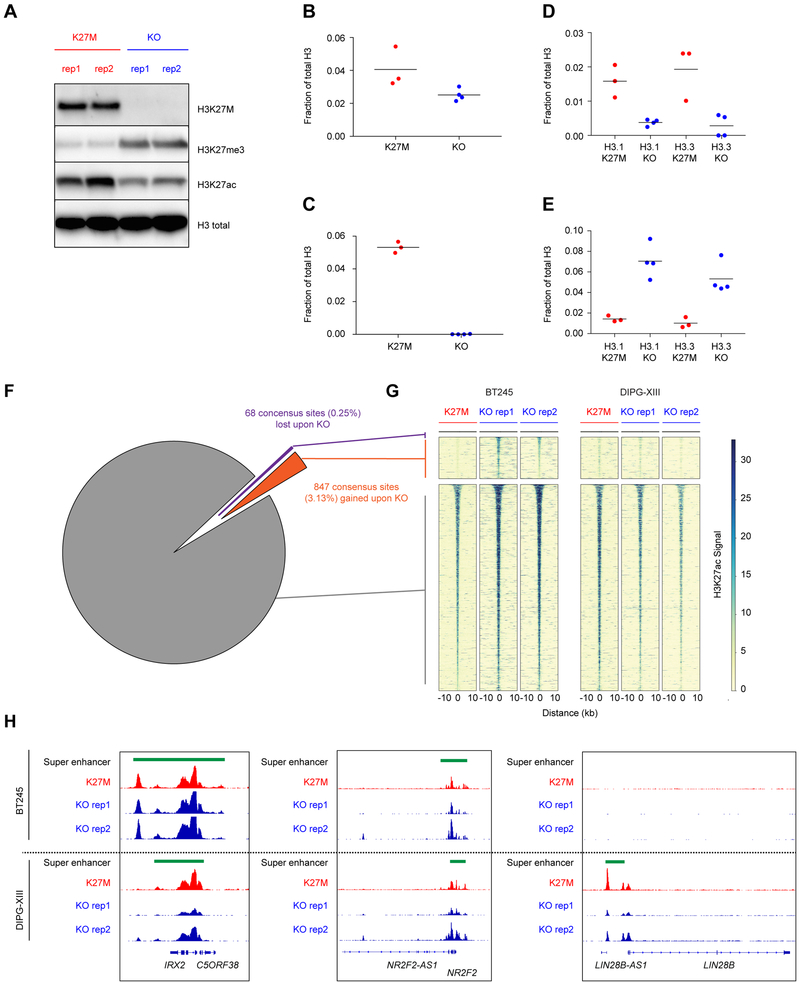
Figure 3. Mapping of H3K27ac in isogenic models of H3K27M reveal minimal alterations of gene transcriptional programs.
(A) Immunoblot in parental and clonal H3K27M knockout lines of DIPG-XIII.
(B-E) Mass spectrometry analysis in DIPG-XIII for total (B), H3K27ac (C), K27M (D) and H3K27me3 (E) peptides among total H3, plot of mean of n=3 or 4 technical replicates. Solid horizontal lines indicate the mean.
(F-G) Pie graph (F) and heatmap (G) illustrating number and proportion of gained, lost, and retained H3K27ac sites consistent between BT245 and DIPG-XIII K27M expressing models as compared to KO lines.
(H) Gene plot illustrating patterns of H3K27ac and super enhancers between H3.3K27M cell models and isogenic KO clones.
See Figures S2 and S3 and Tables S5 and S6.

