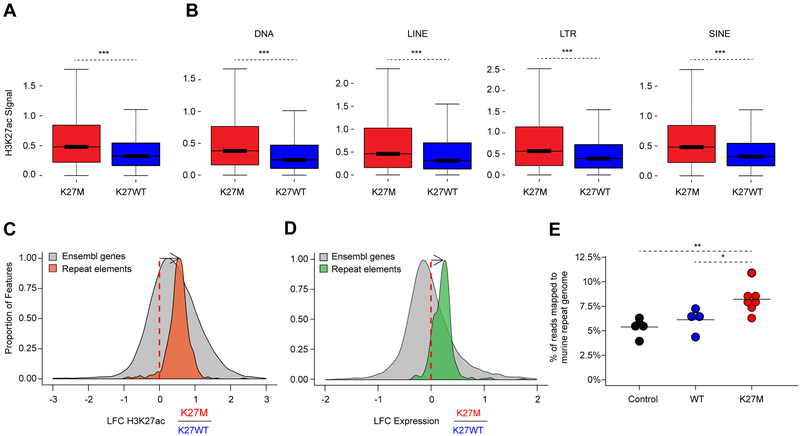
Figure 5. H3.3K27M tumors exhibit increased deposition of H3K27ac and transcription at repetitive elements.
(A) Enrichment of H3K27ac across the human genome in 1 MB windows comparing 2 H3.3K27M versus 3 H3K27WT tumors using a Wilcoxon rank sum test, ***p<0.001. The horizontal line inside the box corresponds to the median, the lines above and below the box delimit the interquartile range (IQR), and the end of the whiskers delimit values up to 1.5 times the IQR.
(B) Enrichment of H3K27ac across repetitive regions (LINE, DNA, LTR, SINE) of the human genome annotated by the RepeatMasker database comparing 2 H3.3K27M versus vs 3 H3K27WT tumors using a Wilcoxon rank sum test, ***p<0.001.
(C-D) Changes in H3K27ac (C) and transcription (D) of repeat elements in H3.3K27M tumors relative to H3K27WT tumors. Histograms show the distributions of the log2 fold-change (LFC) of genomic features in K27M relative to K27WT. Orange: H3K27ac deposition over repetitive elements (ChIP-seq; H3.3K27M n=2; H3K27WT n=3). Green: transcription of repetitive elements (RNA-seq; H3.3K27M n=17; H3K27WT n=15). Grey: H3K27ac (left) and transcription (right) of Ensembl genes (GRCh37). Elements with sufficiently high expression (baseMean > 100) and LFCs in the [−3,3] (C) and [−2,2] (D) ranges shown here.
(E) Proportion of RNA-seq reads that map to the repeat genome in K27M tumors relative to controls in a preclinical K27M mouse model. Black: neural progenitor cell (NPCs) controls (n=4). Teal: NPCs overexpressing H3.3WT (n=4). Red: K27M tumors (n=7). Preclinical K27M mouse model RNA-seq data taken from Pathania et al., 2017. Significance between conditions assessed using a two-sample t-test and is shown by **p<0.01; *p<0.05. Solid horizontal lines indicate the mean.

