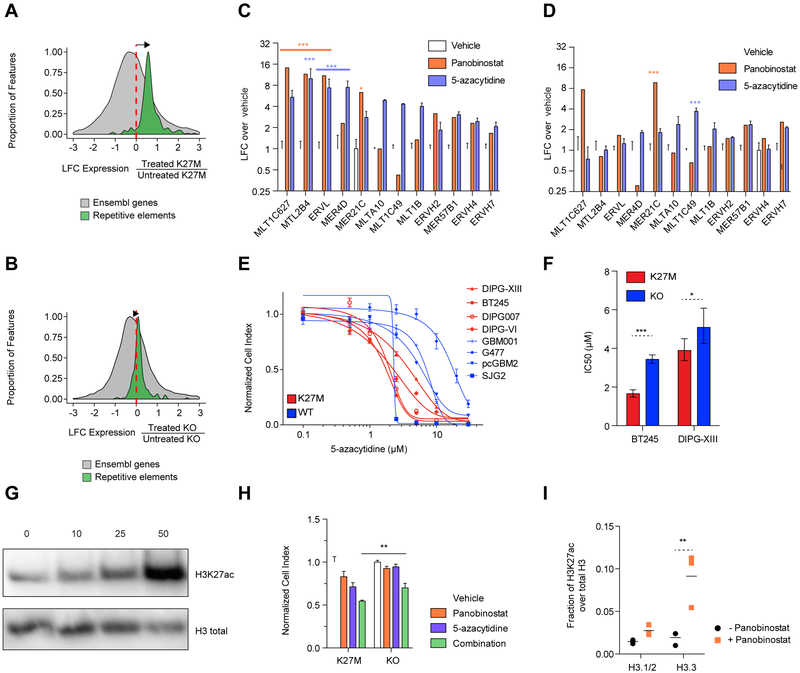
Figure 6. Repeat element primed K27M cells are vulnerable to DNA methylation and histone deacetylase inhibitors.
(A-B) Induction of expression of repetitive element observed in DIPG-XIII (A) and KO lines (B) after combination treatment (panobinostat and 5-azacytidine). Histograms show the distributions of the log2 fold-change (LFC) of transcription of repetitive elements (green; Repbase) and Ensembl genes (grey; GRCh37) based on RNA-seq in treated compared to untreated cells (DIPG-XIII treated n=3, untreated n=3; DIPG-XIII-KO treated n=2, untreated n=2 biological replicates). Elements with sufficiently high expression (baseMean > 100) and LFCs in [−3, 3] range shown here.
(C-D) Measurement of ERV family expression by ddPCR upon 48 hr treatment with panobinostat (50 nM) or 5-azacytidine 5 μM), normalized to vehicle control, in DIPG-XIII (C) and KO lines (D). Plots show mean + SEM of 3 experimental replicates of the DIPG-XIII line. Two-way ANOVA compares vehicle to each drug, with Bonferroni post-test significance shown by ***p<0.001, **p<0.01, *p<0.05. Y-axis is in log2 scale.
(E) Dose-response curves of a panel of HGG lines to 5-azacytidine in a 7 day growth assay in H3K27M and WT lines. Plots show mean +/− SEM of 3 experimental replicates.
(F) The sensitivity of H3K27M and KO lines of BT245 and DIPG-XIII to 5-azacytidine in a 7-day growth assay is portrayed by IC50 values +/− 95% confidence intervals. ***p<0.001, *p<0.05.
(G) Western blot of total H3K27ac levels upon panobinostat treatment of DIPG-XIII at various doses (in nM) for 48 hr.
(H) Cell viability in 7 day growth assay under treatment of lines with sub-IC50 doses of panobinostat (15 nM), 5-azacytidine (1.5 μM) and their combination in DIPG-XIII and isogenic KO lines. Plots show mean + SEM of 3 experimental replicates. A two-tailed t-test compares combination treated lines, with **p<0.01.
(I) Mass spectrometry measurement of H3K27ac levels on histone H3 variants comparing treated and untreated DIPG-XIII cells with 50 nM panobinostat for 48 hr. Plot of mean of 3 experimental replicates. **p<0.01.
See also Figures S5 and S6.

