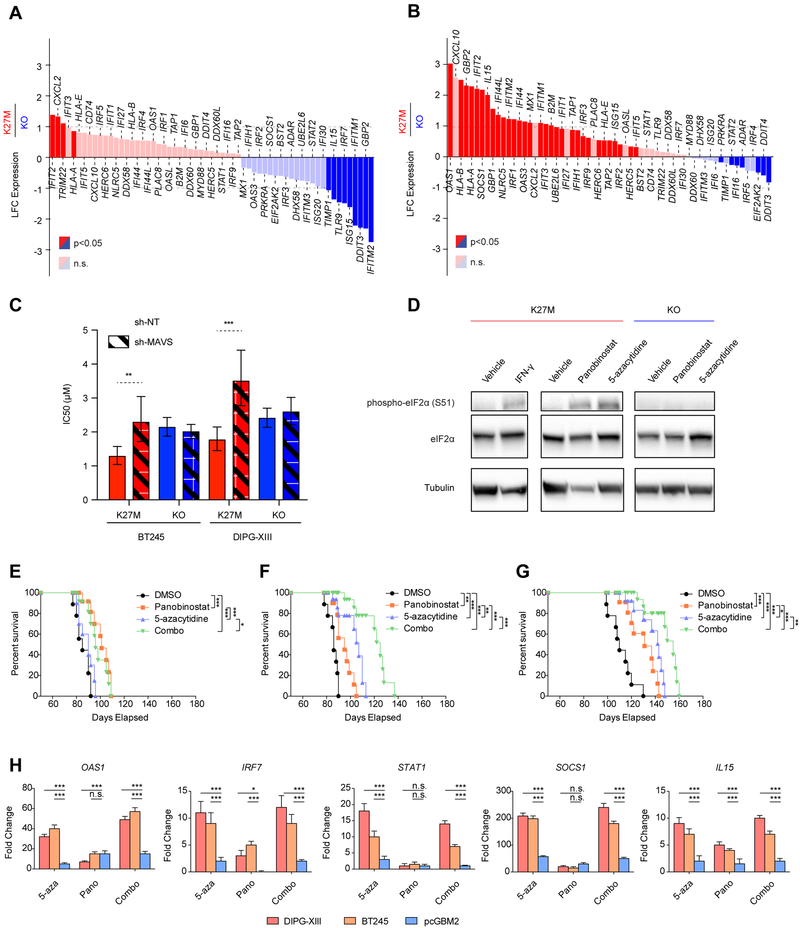
Figure 7. Epigenetic therapies activate interferon response genes and dsRNA sensing pathways.
(A-B) Waterfall plots illustrating changes in the expression levels of ISGs in DIPG-XIII H3K27M cells relative to KO at baseline (A) and upon treatment with 5-azacytidine (B). Y-axis: log2 fold-change of expression in K27M relative to KO (baseline DIPG-XIII n=3, DIPG-XIII-KO n=2; treated DIPG-XIII n=3, DIPG-XIII-KO n=2 biological replicates). Red: upregulated genes in K27M. Blue: downregulated genes. Significantly deregulated genes highlighted (p<0.05; baseMean>100).
(C) The sensitivity of H3K27M and KO lines to 5-azacytidine upon expression of sh-NT (control) or pooled shRNAs targeting MAVS (sh-MAVS), is portrayed by IC50 values +/− 95% confidence intervals. ***p<0.001, **p<0.01. n=3
(D) Immunoblot of phosphorylated eIF2a (serine 51) induced by 48-hr treatment with panobinostat (50 nM) and 5-azacytidine (5 μM) or interferon gamma (IFN-γ, 1000 U/mL) in DIPG-XIII H3K27M cells and KO cells.
(E-G) Survival of mice bearing pcGBM2 (E), DIPGXIII (F), and BT245 (G) xenografts and treated with vehicle, 5-azacytidine, panobinostat, or combination of both drugs. Statistical significance measurements were determined using a Log-Rank test. n=9 animals per condition.
(H) Induction of interferon signature genes in patient-derived tumor xenografts treated. Mice were treated with vehicle, 5-azacytidine, panobinostat, or combination of both drugs, and tumors were isolated at end point and analyzed by qPCR. The fold change of expression compared to DMSO treated tumors is presented as mean + SD and statistical significance was determined using a two-way ANOVA test on 4 distinct biological replicates for each condition. ***p<0.001, **p<0.01 (what analysis was done (PCR?), what are the p values; what is the fold change relative to; how are the data presented (mean + SEM?)

