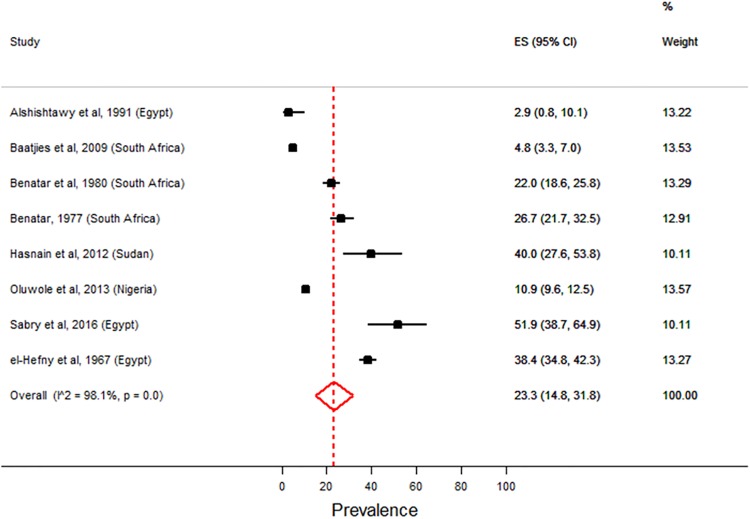
Fig 4. Forest plot showing meta-analysis on prevalence of fungal sensitisation.
There was a lot of variation in the prevalence of fungal sensitisation across the eight studies included in the meta-analysis (p-value <0.01). Broken vertical line indicates the combined (overall) estimates. ES (95% CI) denotes weighted estimates of prevalence and their 95% confidence intervals based on the variance in each individual study.

