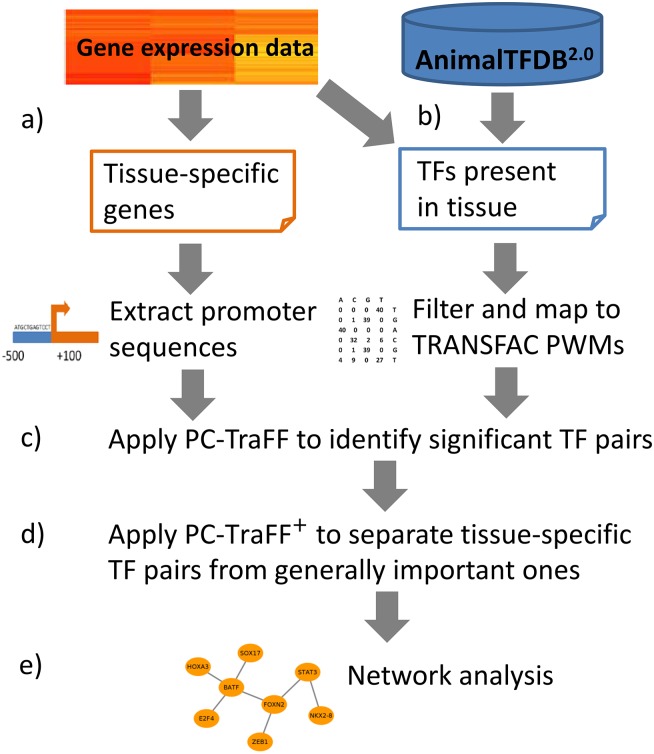
Fig 2. Flowchart of analysis procedures.
(a) Identification of tissue-specific genes from RNA-seq data and extraction of promoter region of genes. (b) Identification of TFs expressed for each tissue in RNA-seq data. (c) Application of PC-TraFF [1]. (d) Application of PC-TraFF+ [26]. (e) Reconstruction of tissue-specific TF-TF cooperation networks.

