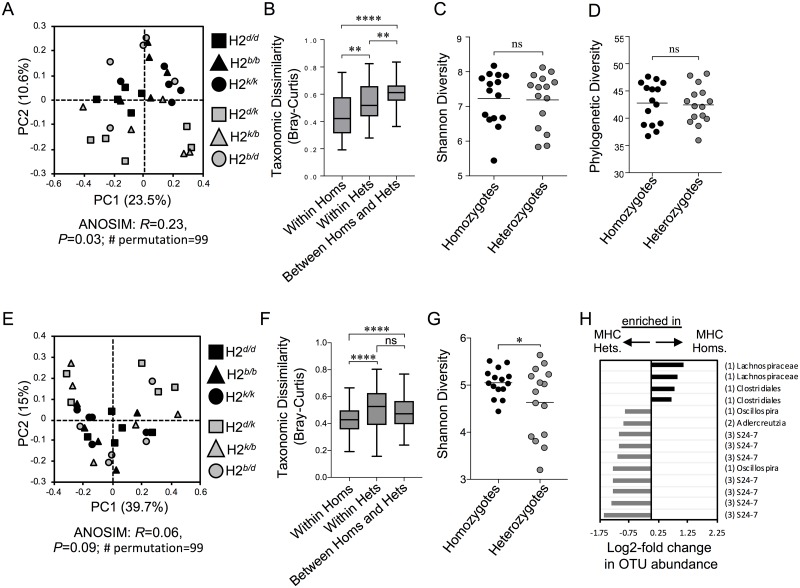
Fig 1. MHC heterozygosity alters microbiota composition and drives community divergence among individuals.
A) PCoA of beta-diversity comparison of overall community taxonomic composition between MHC homozygote and MHC heterozygote animals. Bray-Curtis analysis, ANOSIM: R = 0.23; P = 0.03; no. of permutations = 99. B) Boxplots representing within-group taxonomic dissimilarity and taxonomic dissimilarity comparisons between MHC homozygote and MHC heterozygote overall community. Comparison of alpha diversities in overall communities between MHC homozygote and MHC heterozygote animals based on Shannon (C), and phylogenetic diversity (D) indices. E) PCoA of beta-diversity comparison of core community between MHC homozygote and MHC heterozygote animals. Bray-Curtis analysis, ANOSIM: R = 0.06; P = 0.09; no. of permutations = 99. F) Boxplots representing within-group taxonomic dissimilarity and taxonomic dissimilarity comparisons between MHC homozygote and MHC heterozygote core community. G) Comparison of alpha diversities in core communities between MHC homozygote and MHC heterozygote animals based on Shannon diversity index. H) Differential enrichment in abundance of specific taxa within the core microbiota of MHC homozygote and MHC heterozygote animals. The significance threshold in this plot was P <0.05, Benjamini-Hochberg corrected. X-axis shows the values of log2FoldChange, where positive values indicate the taxa enriched in homozygotes (black) and negative values indicate the taxa enriched in heterozygotes (grey). 1 = Firmicutes (Clostridiales); 2 = Actinobacteria; and 3 = Bacteroidetes. Symbols (*), (**), (***), and (****) indicate the Benjamini-Hochberg corrected significance values of P < 0.05, P < 0.01, P < 0.001, P < 0.0001 respectively, which were calculated using non-parametric two sample t-test.

