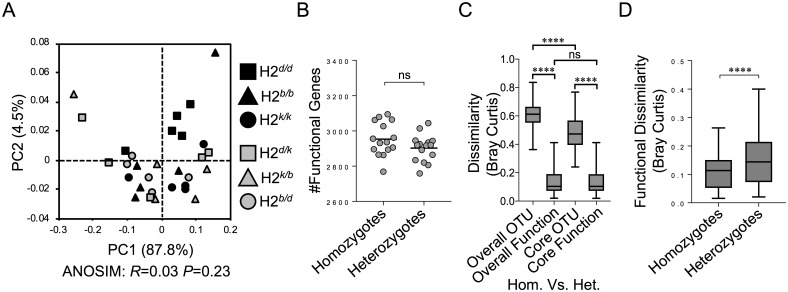
Fig 2. MHC heterozygosity drives functional divergence among individuals.
A) PCoA of functional beta-diversity comparison between MHC homozygote and MHC heterozygote animals based on Bray-Curtis analysis of PICRUSt-annotated KEGG Orthology (KO) genes (ANOSIM: R = 0.03; P = 0.23; no. of permutations = 99). B) The number of functional genes is compared between MHC homozygote and MHC heterozygote animals. C) Boxplots representing within-group functional dissimilarity comparisons between MHC homozygotes and MHC heterozygotes based on Bray-Curtis analysis. D) Boxplots representing within-group predicted KO gene dissimilarity between MHC homozygote and MHC heterozygote animals based on Bray-Curtis analysis. Symbol (****) indicates Benjamini-Hochberg corrected significance values of P < 0.0001, which were calculated using non-parametric two sample t-test.

