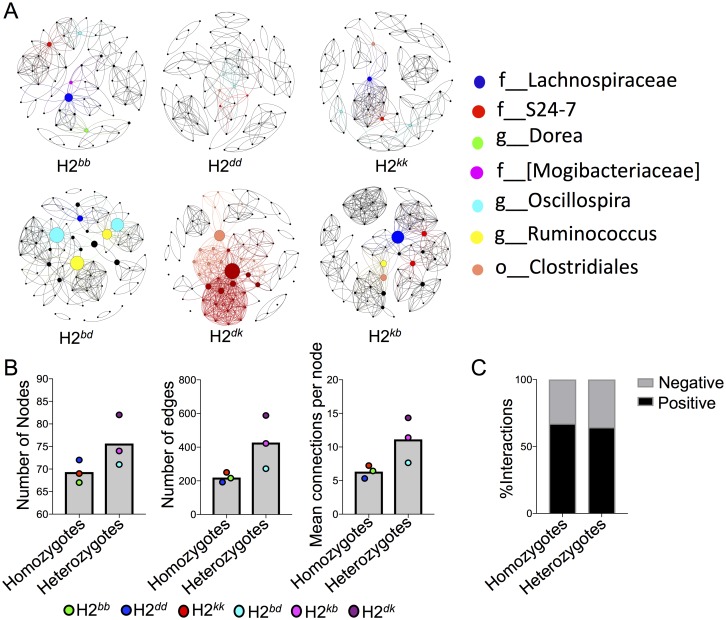
Fig 4. MHC heterozygotes have a more connected microbial network in core communities.
A) Plots depict association between microbial species using Spearman correlation coefficient values of >0.8 for positive correlations, and <-0.8 for negative correlations with statistical significance P<0.01, Benjamini-Hochberg corrected. The microbial pairs that follow these criteria were considered to have strong association among them and included in network study. In the network analysis, nodes represent microbial taxa (OTUs), and lines (or edges) connecting the nodes represent significant pairwise correlations in species abundances. The size of the nodes is proportional to their betweenness centrality values. Nodes with highest betweenness centrality values (“hub” species; here we considered top seven OTUs across networks), along with their edges, are colored for comparative understanding of their connectedness across genotype-wise networks. These nodes are identified taxonomically in the accompanying legend. B) The comparative analysis of few network topologies between MHC homozygote and MHC heterozygote networks, number of nodes, number of edges, mean connection per node (i.e., ratio between number of edges and number of nodes in a network), and relative proportion of positive and negative correlations are illustrated.

