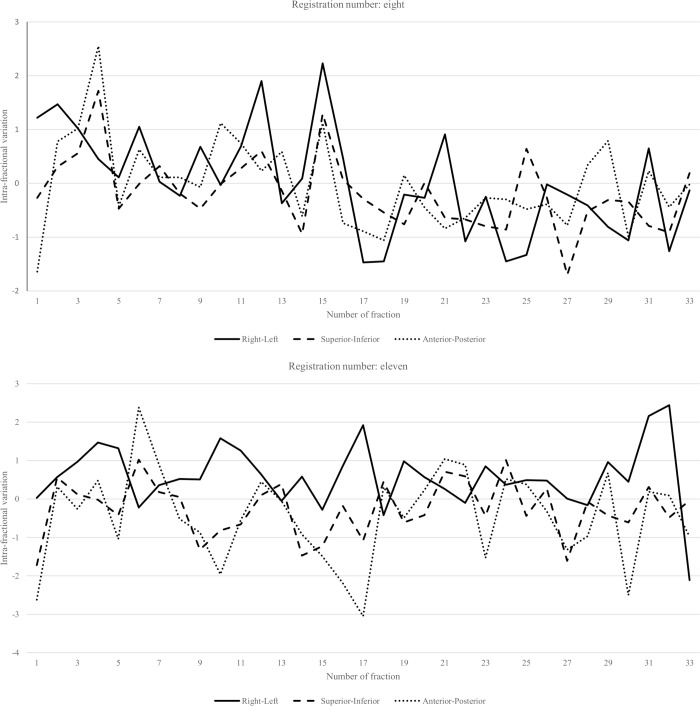
Fig 7.
(A) Intra-fractional error of patient number eight. Simulation had to be repeated in this patient after the 15th fraction. The average and standard deviation of three-dimensional intra-fractional variations before and after repeated simulation were 1.37±0.84 mm and 1.19±0.51 mm, respectively. (B) Intra-fractional error of patient number 11. Simulation had to be repeated in this patient after the 17th fraction. The average and standard deviation of three-dimensional intra-fractional variations before and after repeated simulation were 1.73 ± 1.02 mm and 1.46 ± 0.68 mm, respectively.

