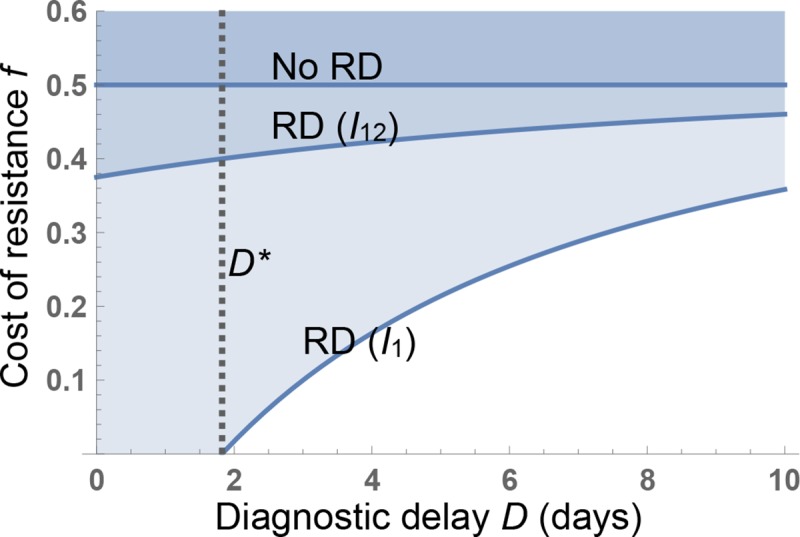
Fig 2. Rapid RD enable conditional treatment and infection control strategies that can select against resistance for obligate pathogens even with no biological costs of resistance.

The minimal cost of resistance f*(D) that allows universal treatment without causing an increase in resistance is plotted (contour lines) against diagnostic delay D. The dashed vertical line indicates the longest diagnostic delay (D*) given which there is selection against drug 1 resistance while treating all cases. Three scenarios are shown: RD not available (No RD, contour plot of ); RD control of I1 only (RD (I1), contour plot of ); and RD control of I12 (and trivially, I1) (RD (I12), contour plot of ). Parameters (rates per day): , , . RD, resistance diagnostics.
