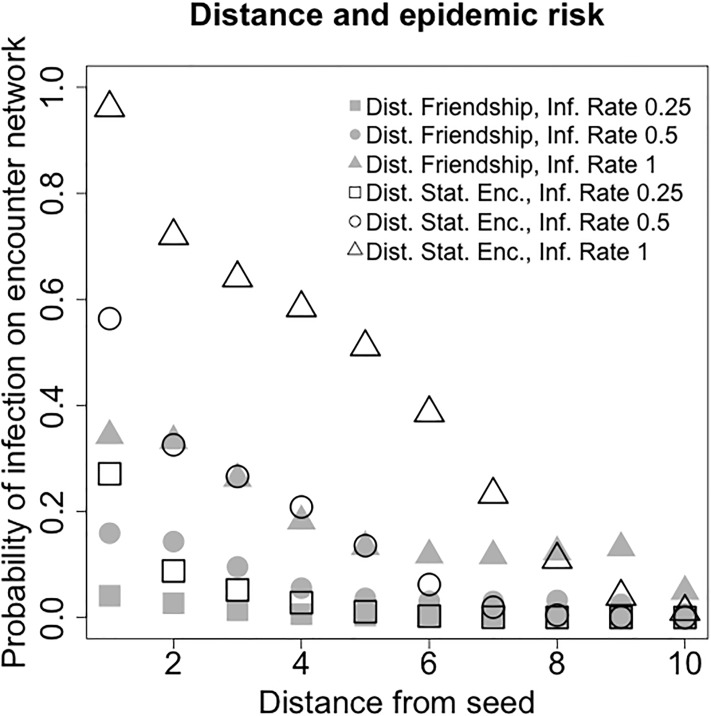
Fig 4. Risk of infection on the encounter network versus distance from the infection seed.
Both distance from the seed on the friendship network and distance from the seed on the static encounter network are considered. For each value of the infection rate β and each notion of distance from the seed, 10,000 simulations on the encounter network initiated at random single seeds are run. The x-axis plots the distance d from the seed, the y-axis plots the empirical probability that nodes at distance d become infected on the encounter network (distance on the friendship network: grey; distance on the static encounter network: white).

