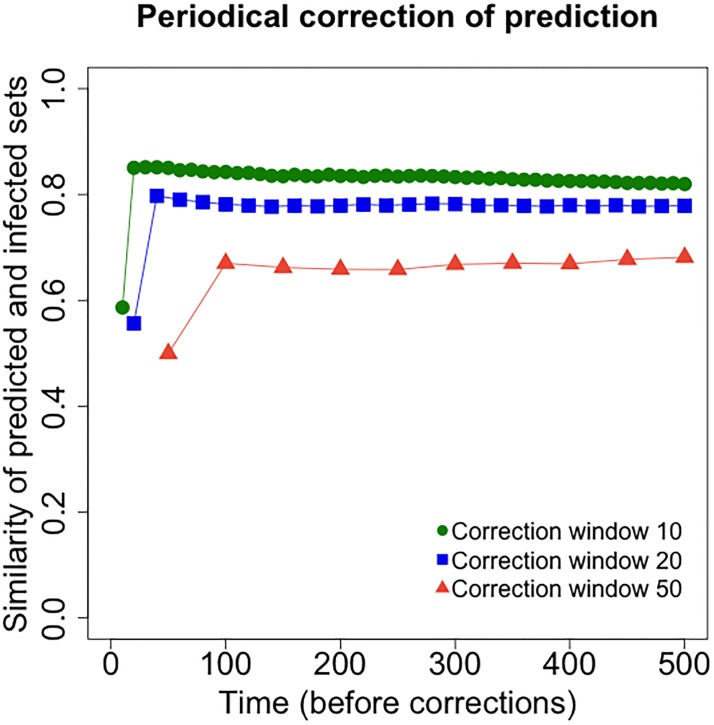
Fig 6. Periodical correction of risk prediction using the friendship network.
Shown here is the average Jaccard similarity between the predicted infected sets (according to infections spreading on the friendship network, and periodic corrections) and the infected sets given by infections spreading on the encounter network, before each correction and for different values of the observation window W. For each W ∈ {10, 20, 50}, 6000 single seeds are selected at random, and for each seed one simulation on the encounter network and one (with periodic corrections) on the friendship network are run. The x-axis shows time, the y-axis shows Jaccard similarity. Higher values of the y-axis correspond to higher prediction accuracy.

