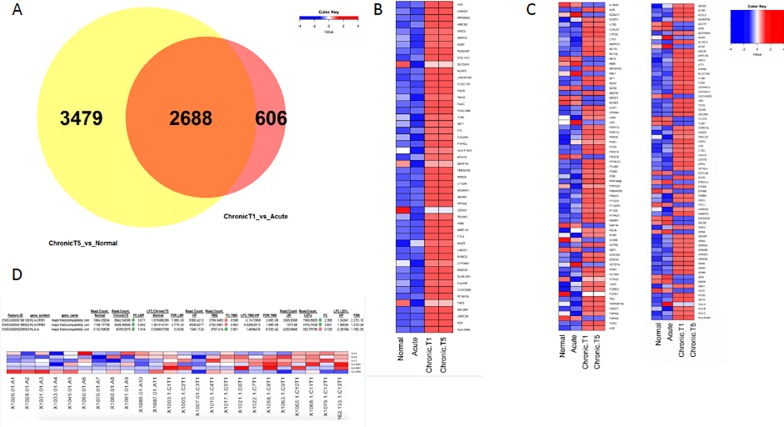
Fig 2. Comparisons in differential gene expression among normal control (single timepoint) and cases (acute and chronic T1 and T5).
(A)Venn diagram showing that 2,688 differentially expressed genes (LFC ±0.58; FDR p-value ≤ 0.05) overlap between the two contrasts. (B) Heat map showing the top 50 up-regulated (left) and down-regulated (right) protein-coding genes in all four groups [healthy participants (normal), acute, chronic T1 and chronic T5]. Color key shows the z-score for downregulated genes (blue) and upregulated genes (red). (C) A one-tailed Fisher’s Exact test was used to compute a hypergeometric p-value to determine whether the differentially expressed genes from each contrast (chronic T5 versus normal control group and chronic T1 versus acute group) were significantly enriched for known pain genes (dataset constructed from multiple literature and online database sources (see supplemental methods for detail). The p-value for known pain genes = 1.26E-09 for the chronic T5 versus normal participants contrast, and p = 2.62E-08 for the chronic T1 versus acute contrast and for genes that form the extended MHC locus. The heatmap depicts known pain genes. Color key shows the z-score for downregulated genes (blue) and upregulated genes (red). (D) We computed the one-tailed Fisher’s Exact test to obtain a p-value for genes that reside in the extended MHC genomic locus (see supplemental methods for detail). The p-value for genes in the extended MHC genomic locus was only significant for the chronic T1 versus acute contrast (p = 1.43E-02).

