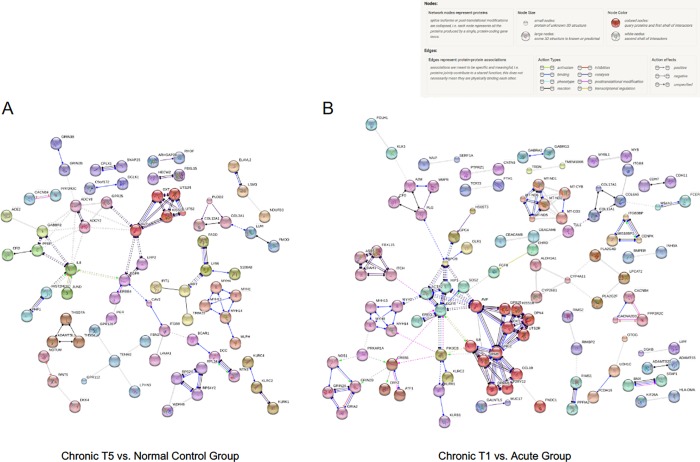
Fig 4. Protein-protein interaction network analysis demonstrates clusters of co-expressed genes.
Evidence for significant protein-protein interactions was demonstrated using STRING v10. For both contrasts (chronic T5 versus normal controls; chronic T1 versus acute), we analyzed the top 500 differentially expressed genes (250 upregulated, 250 downregulated). For the analysis, we specified high confidence (0.70) for cluster positions in the network as determined by an algorithm that computes a global confidence binding score. We next removed all disconnected nodes and then applied the Markov Cluster Algorithm (MCA) to extract clusters of densely connected nodes from biological networks. (A) String v10 analysis of gene expression analysis from chronic T5 compared with normal controls. Of the top 500 differentially expressed genes, 327 were identified in the database. The final network is comprised of 327 nodes and 150 edges. The random number of edges is 92. The protein-protein interaction (PPI) enrichment p-value = 1.88E-08. (B) String v10 analysis of gene expression in chronic T1 compared with the acute group. Of the top 500 differentially expressed genes, 263 were identified in the database. The final network is comprised of 263 nodes and 84 edges. The expected number of edges is 64. The PPI enrichment p-value = 0.0107.

