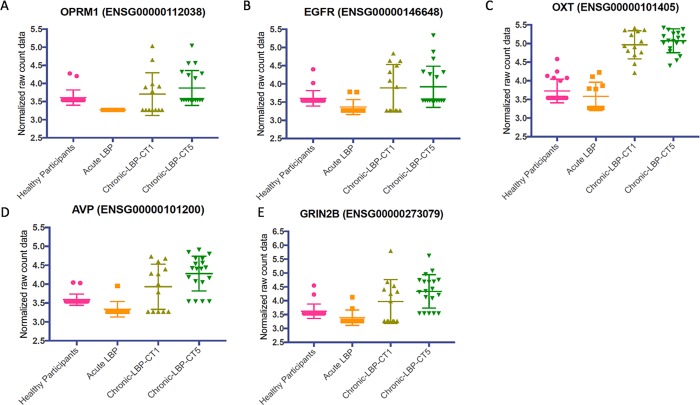
Fig 5. The whole blood gene expression levels for known or suspected pain genes that were members of major clusters from String 10 protein-protein interaction analysis were plotted.
The analysis demonstrates that levels of each gene are differentially higher in the chronic T1/chronic T5 patients compared with acute and normal control participants. In each panel, the raw, normalized, non-zero gene expression counts from DESeq analysis are displayed as a scatter plot for each cohort. Symbols indicate individual expression levels for each of the N = 64 participants. A Kruskal-Wallis 1-way ANOVA was used to examine comparisons. In all cases, the expression levels for each gene were higher in the chronic T1 and chronic T5 groups compared with normal control participants and the acute group. (A) Opioid receptor mu 1 (OPRM1) gene (H = 27.64, p< 0.0001). (B) Epidermal growth factor receptor (EGFR) gene (H = 15.29, p = 0.0016). (C) Oxytocin (OXT) gene (H = 47.43, p<0.0001). (D) Arginine vasopressin (AVP) gene (H = 31.44, p<0.0001). (E) Glutamate ionotropic receptor NMDA type subunit 2B (GRIN2B) gene (H = 24.25, p<0.0001).

