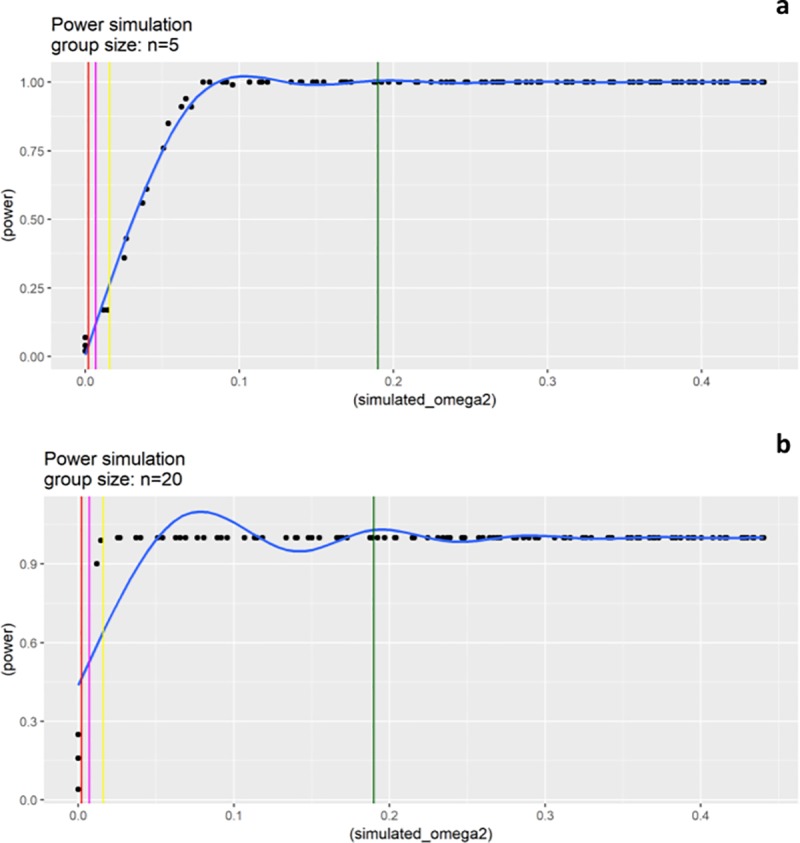
Fig 5.

Power/Effect size (omega2) simulations with a sample size of n = 5 (a) and n = 20 (b) per group. The colored vertical lines represent the ω2 values calculated on our experimental groups; dark green = Effect size for timepoint factor, yellow = Effect size for genotype factor at timepoint I, magenta = Effect size for genotype factor at timepoint III, red = Effect size for genotype factor at timepoint II.
