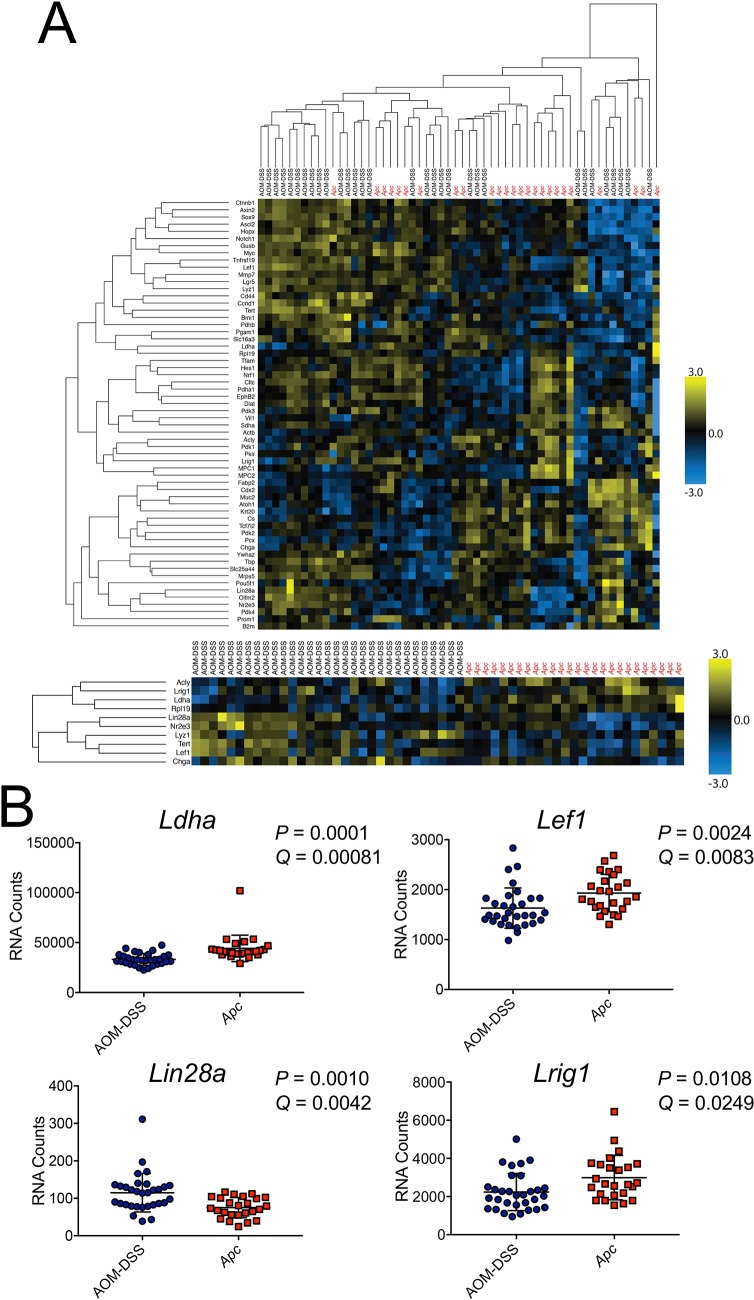
Fig 7. Gene expression profiling reveals a signature of genes that are differentially expressed between the two tumor models.
(A) Gene expression analysis performed using a custom probeset with 31 AOM-DSS tumors (23 FFPE, 8 snap-frozen) and 25 Apcfl/+-LOH tumors (12 FFPE, 13 snap-frozen). Top: A heatmap is shown using unsupervised hierarchical clustering using all genes in the probeset. Bottom: Forced clustering by tumor type, showing top clustering of genes based upon mean change and ranked adjusted P-value. (B) The overall expression level per tumor sample is shown for example genes (Ldha, Lef1, Lin28a, Lrig1) that show significant differential expression based on tumor type.

