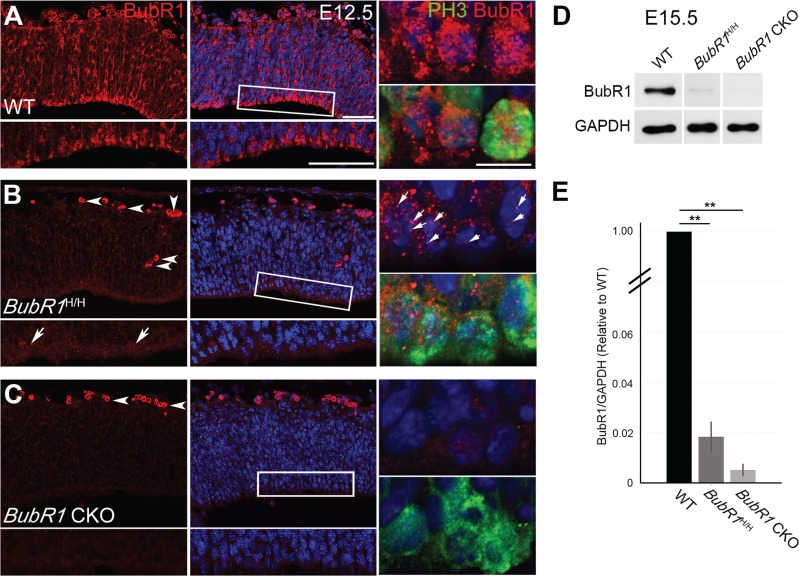
Figure 3.
Depletion of BubR1 during neurogenesis is nearly complete in BubR1 CKO. (A–C) At E12.5, minimal BubR1 is present at the ventricular surface in BubR1H/H neuroepithelium (B, inset, arrows), where it is located on the chromosomes of PH3+ cells undergoing mitosis (arrows). It is almost completely absent in BubR1 CKO (C) but highly enriched in WT (A). Arrowheads indicate nonspecific or auto-fluorescence signals from blood cells (B and C). (D) Western blot of E15.5 cortices confirms significant reduction of BubR1 expression in BubR1H/H and BubR1 CKO compared to WT. (E) The graph compares the relative levels of BubR1 protein in the BubR1H/H and BubR1 CKO to the WT level after normalization with GAPDH. **P < 0.01. Scale bar, 50 μm; enlarge image, 10 μm.

