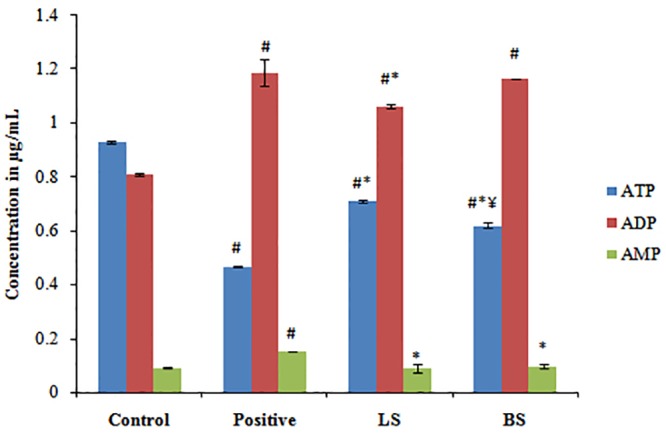
Fig 4. Effect of fermentation supernatant LS and BS on ATP synthesis in HT29 cells.

ATP, ADP and AMP content of untreated, positive control, LS and BS treated cell sare plotted. The values denotes average of triplicate measurements. #,*,Correspondingly shows significant difference from control and positive group. ¥BS shows significant change from LS. p ≤0.05 was considered statistically significant.
