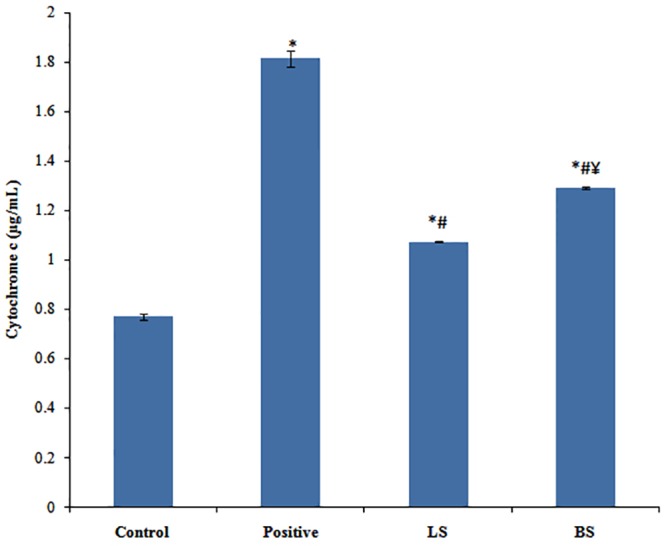
Fig 5. Histogram showing concentration of cytochrome c released from untreated, positive control, LS and BS experimental group.

The values depicts average of triplicate measurements. *,#Correspondingly shows significant difference from control and Inulin group. ¥BS shows significant change from LS.p ≤0.05 was considered statistically significant.
