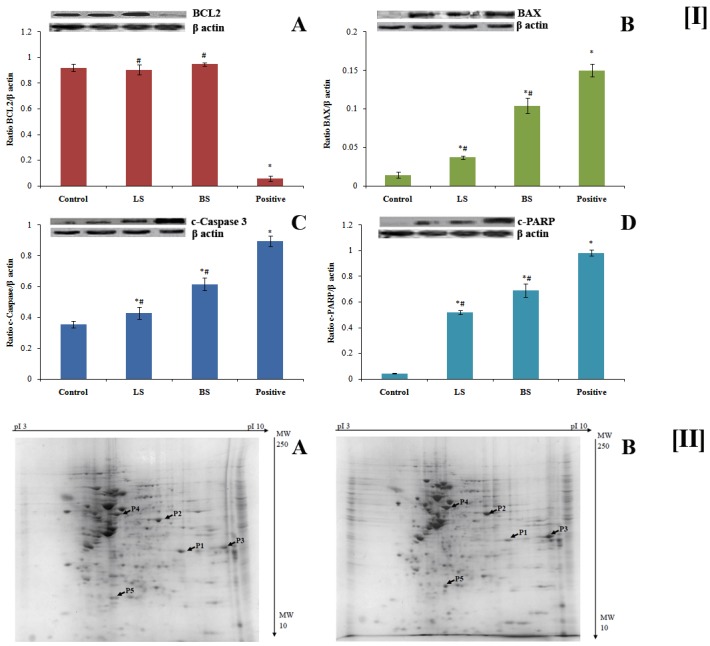
Fig 6.

[I] Effect of fermentation supernatant LS and BS on the expression of apoptotic proteins. Protein from untreated, LS, BS and 5-Fluorouracilexperimental groupswere loaded in lanes 1–4 respectively. A-D correspondingly shows BCL2, BAX, c-caspase 3 and c-PARP. The values are average of three different readings. * and # Significantly different with respect to control and positive group respectively. p ≤0.05 was considered statistically significant.[II] Two dimensional profile of total protein from untreated (A) and BS treated (B) HT-29 cells. (B) BS. The identified proteins are indicated by P1 to P5.
