. 2019 May 7;8:e47098. doi: 10.7554/eLife.47098

Figure 1. Pol II recruitment to Replication Compartments exhibits hallmarks of liquid-liquid demixing.

(A) Representative fluorescence and phase images in uninfected and infected cells. RCs shows a different phase value compared with the surrounding nucleoplasm. Red arrows show matched examples of RCs in the two channels. (B) Time-lapse images of Pol II recruitment to RCs. Zoom in shows RC fusion events. See also Figure 1—video 1 and 2. (C) Aspect ratios (max diameter/min diameter) of RCs from 817 RCs in 134 cells, 3 to 6 hpi. Red ellipses provided a guide to the eye of different aspect ratios. (D) IUPred scores for two Immediate Early viral proteins, ICP0 and UL54, as a function of residue position. Green boxes are predicted IDRs. (E) The fraction of each protein in the viral proteome that is unstructured, separated by kinetic class. HSV1 proteins are compared to a curated list of proteins containing IDRs known to drive phase separation (Cited IDRs). (F) FRAP curves of Pol II in RCs from 3 to 4 hpi, 4–5 hpi, and 5–6 hpi (n = 24, 33, and 33), compared with uninfected cells (n = 31). Shown is the mean flanked by SEM. (G) Infected HaloTag-RPB1 cell lines with a C-terminal domain containing different numbers of heptad repeats. (H) Pol II localization 1, 5 and 10 min after 10% 1,6-hexanediol treatment. All scale bars are 10 µm. Source data for of the list of IDRs in the HSV genome as well as previously cited IDRs can be found in Figure 1—source datas 1 and 2, respectively.

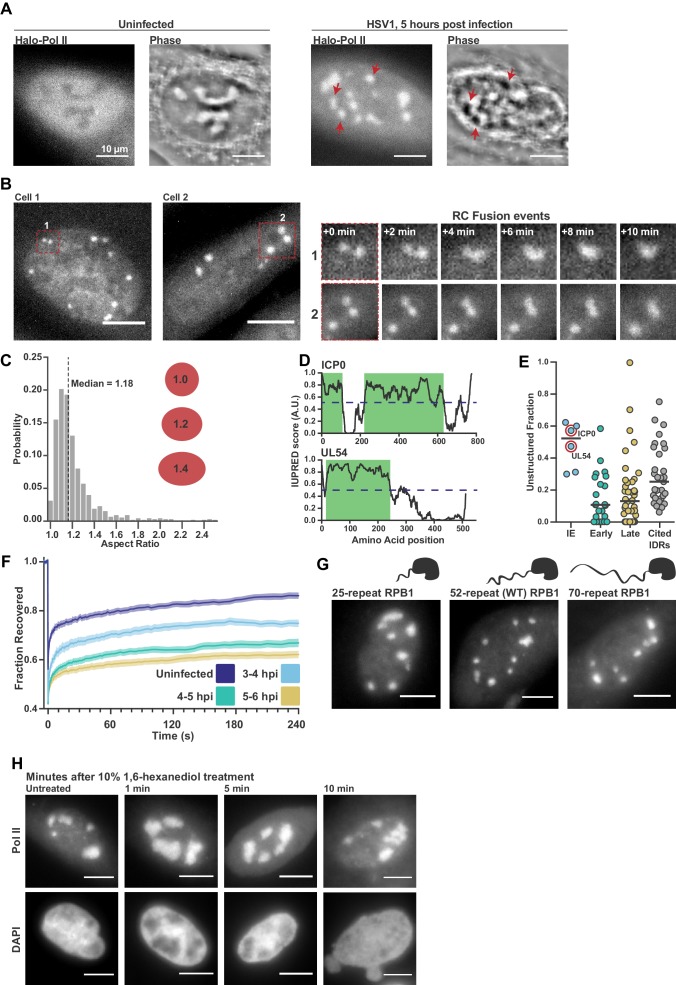
Figure 1—source data 1. List of putative IDRs in the HSV1 genome identified by IUPred.
Each protein listed was analyzed as described in the Materials and methods section, and regions with an IUPred score of greater than 0.55 were recorded.
DOI: 10.7554/eLife.47098.004
Figure 1—source data 2. List of proteins reported to undergo phase separation.
Gene name, organism of origin, size, and the fraction of the protein that scores as an IDR according to the analysis described in the Materials and methods section. References and the citation within and provided.
DOI: 10.7554/eLife.47098.005

Figure 1.

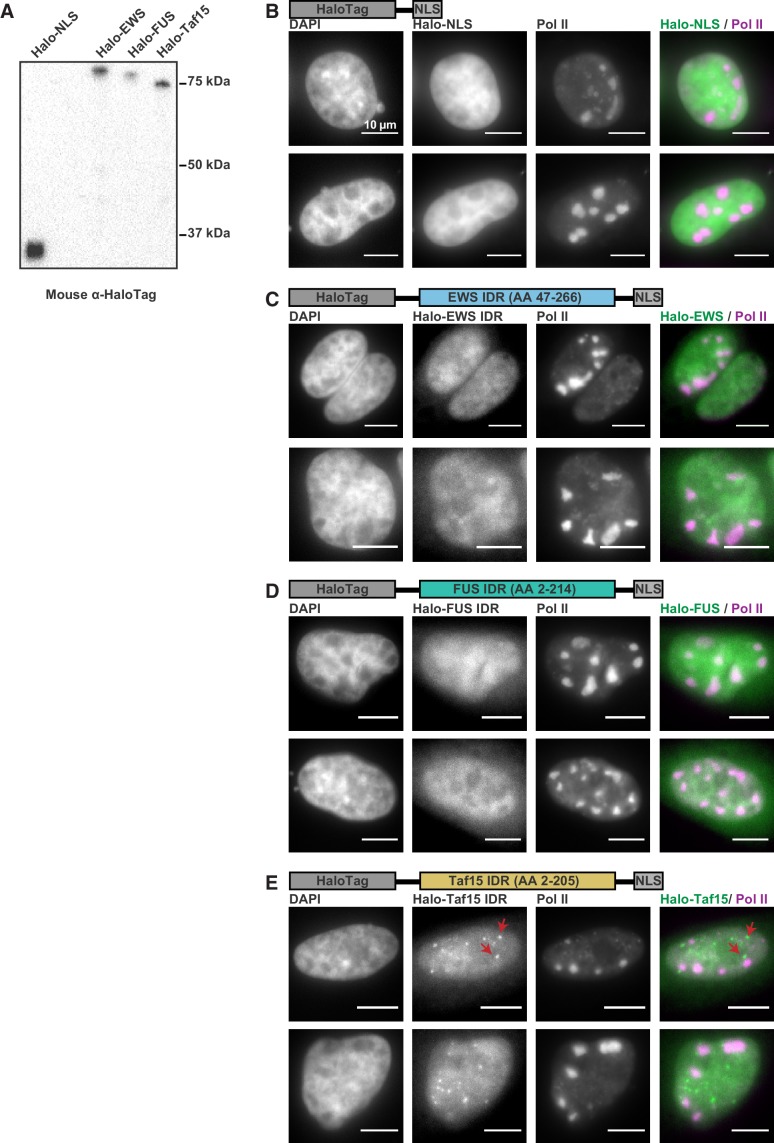
Figure 1—figure supplement 1. FET family IDRs are not recruited to RCs.

Figure 1—figure supplement 1.

(A) Western blot of whole cell extracts of U2OS cells transfected with Halo-NLS, Halo-EWS(LC), Halo-FUS(LC), and Halo-Taf15(LC). (B–E) Two representative SNAPtag-Pol II cells expressing Halo-NLS (B), and the HaloTag fused to the IDRs from EWS (C), FUS (D), and Taf15 (E) (Chong et al., 2018). Cells were fixed 5 hr post infection. The Taf15 IDR has strong enough homotypic interactions to form puncta in nuclei (red arrows), but no IDR was enriched in RCs. All scale bars are 10 µm.
Figure 1—video 1. Time lapse movie of HaloTag-Pol II after HSV1 infection.
Download video file (5.9MB, mp4)
DOI: 10.7554/eLife.47098.006
Cells were identified three hpi, and followed until they moved out of the focal plane.
Figure 1—video 2. Time lapse movie of HaloTag-Pol II after HSV1 infection.
Download video file (2.3MB, mp4)
DOI: 10.7554/eLife.47098.007