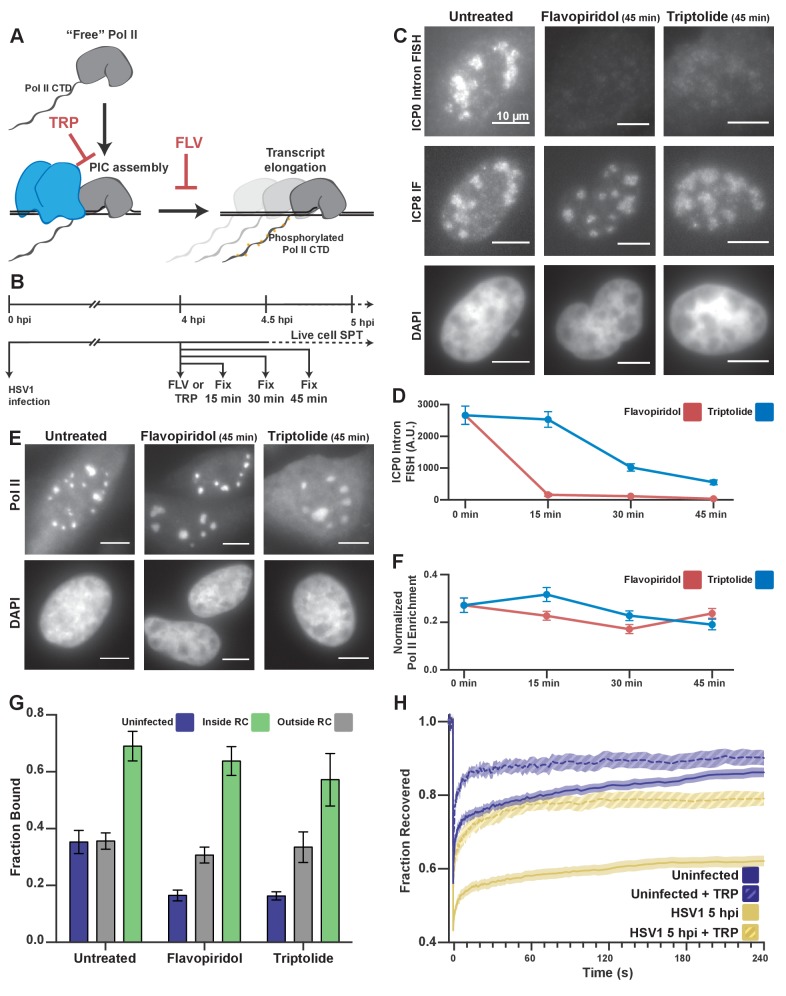
Figure 3. Pol II recruitment to RCs occurs independent of active transcription.
(A) Schematic of Pol II-mediated transcription inhibition. (B) Schematic of the experiment regimen for imaging infected cells after transcription inhibition. (C) RNA FISH against the ICP0 intron to measure nascent transcription after Flavopiridol or Triptolide treatment. ICP8 marks viral RCs. (D) Quantification of the ICP0 intron signal in untreated cells (n = 170 RCs) those treated with TRP(n = 192, 171, 191 RCs, respectively) and FLV(n = 158, 238, 153 RCs, respectively). Error bars are standard error of the mean. (E) Halo-Pol II distribution after 45 min of Triptolide or Flavopiridol treatment. All scale bars are 10 µm. F) Quantification of the total fraction of Pol II recruited to RCs in untreated cells (n = 29) with TRP(n = 33, 24, 33, respectively) and FLV(n = 36, 24, 38, respectively). Error bars represent standard error of the mean. (G) Mean fraction bound measured from spaSPT of Halo-Pol II, after transcription inhibition. Error bars are the standard deviation of the mean, calculated as described in STAR methods. (H) FRAP recovery curves of Pol II with (hashed) and without (solid) Triptolide treatment, for uninfected cells (n = 31, nine respectively) and cells infected with HSV1, 5hpi (n = 32, 12 respectively).


