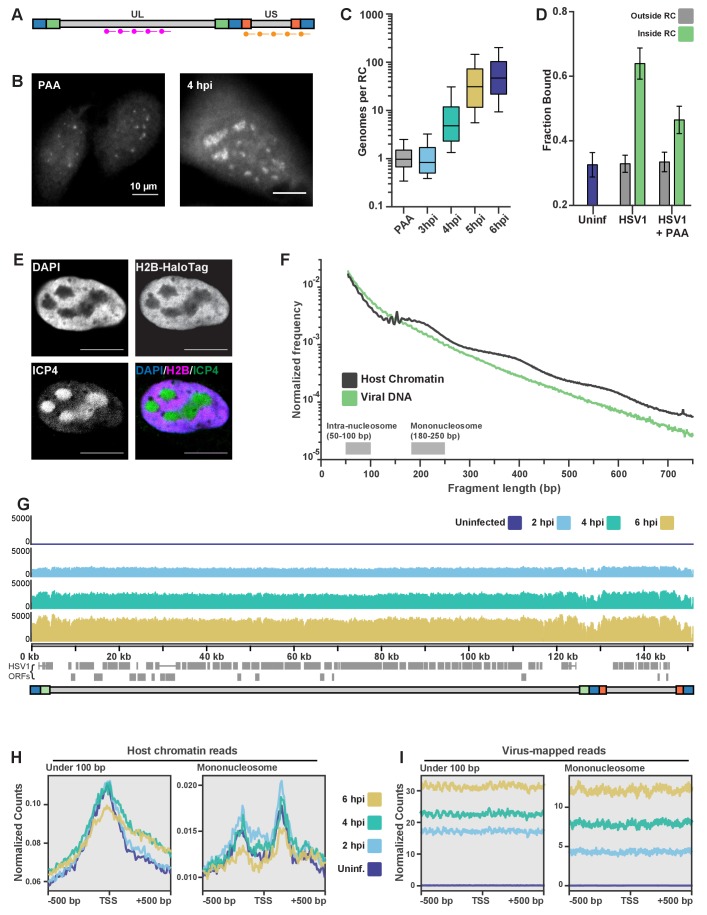
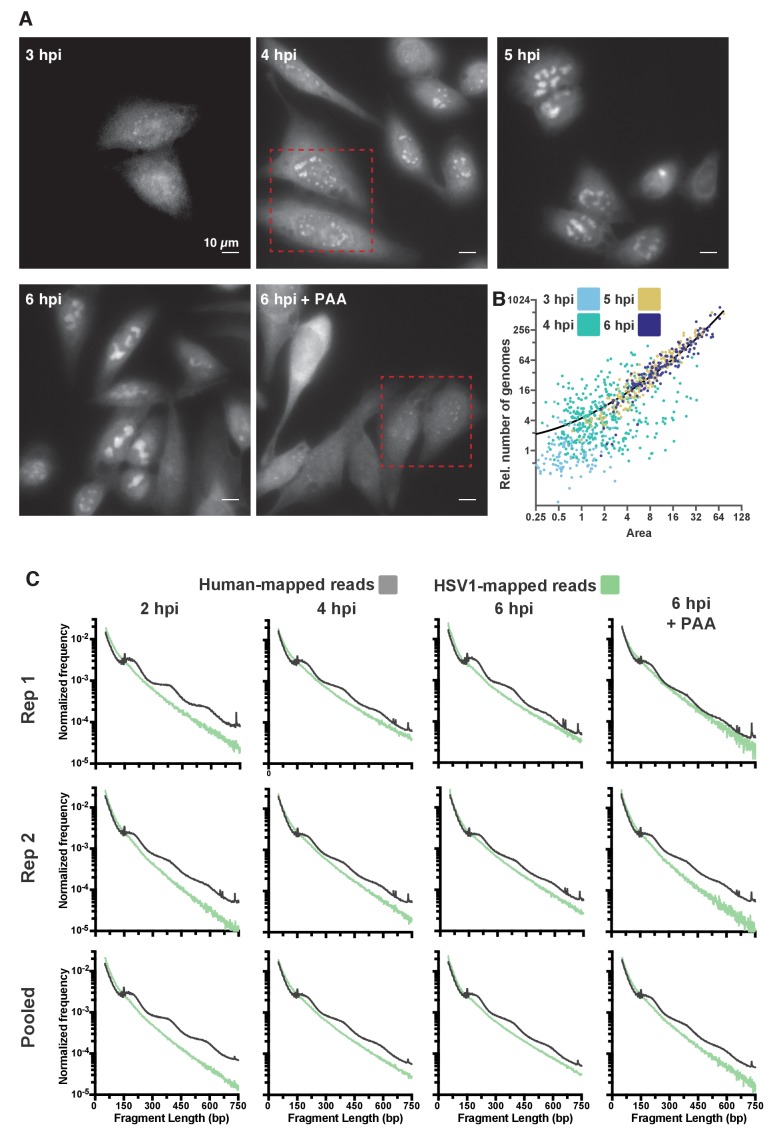
Figure 4. ATAC-seq reveals HSV1 DNA is much more accessible than chromatin.
(A) Schematic of the Oligopaint targets for DNA FISH. Separate probe sets target regions in the Unique Long (UL) arm and the Unique Short (US) arm. B) Representative images of DNA FISH of cells four hpi, infected in the presence (PAA, left) or absence (4hpi, right) of the replication inhibitor PAA. Pixel intensity values are the same for the two images. Scale bars are 10 µm. (C) Fluorescence intensity of DNA FISH signal in RCs after infection. 5–95% intervals are shown, with inner quartiles and median. Data are normalized to the median intensity value of PAA-treated infected cells. Medians: PAA = 1.0, 3 hpi = 0.8, 4 hpi = 4.8, 5 hpi = 31.1, 6 hpi = 47.0. (D) Mean fraction bound for Pol II in infected cells with and without PAA. Error bars are the standard deviation of the mean, calculated as described in Materials and methods. (E) H2B-Halo cells show histone H2B is not incorporated into RCs. Innumofluorescence against ICP4 marks RCs. (F) Fragment length distribution of ATAC-seq data for cells 4 hpi. Lengths corresponding to intra-nucleosomal DNA (50–100 bp) and mononucleosomal DNA (180–250 bp) are marked as a reference. (G) ATAC-seq read density plotted across HSV1 genomic coordinates. (H) ATAC-seq analysis of intra-nucleosomal DNA (50–100 bp) and mononucleosomal DNA (180–250 bp). Global analysis of all human Pol II-transcribed genes, centered at the transcription start site (TSS). (I) The same analysis as in (G), but centered at the TSS of HSV1 genes.


