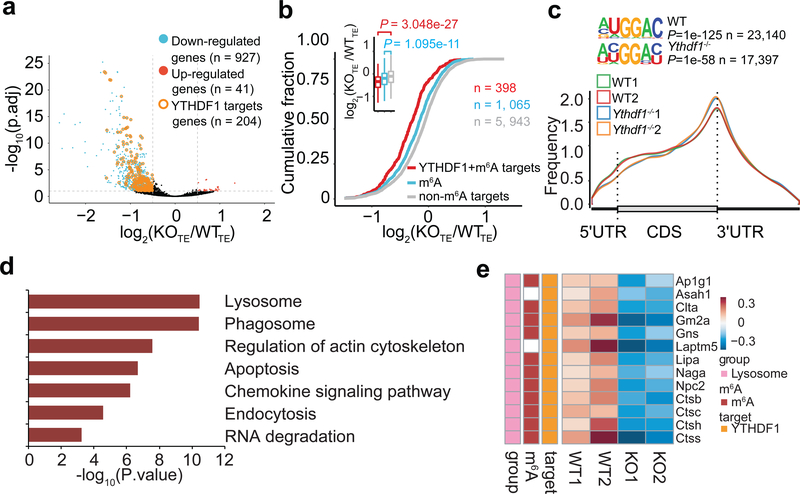
Figure 3 |. Transcriptome-wide identification and analysis of the YTHDF1-binding sites.
a, Volcano plots of genes with differential translational efficiency in WT and Ythdf1−/− Flt3L-DCs. Transcripts with significant YTHDF1 binding sites in 3’ UTR were marked with yellow circles. P values were calculated by two-sided likelihood ratio test and adjusted by Benjamini & Hochberg method; n = 4 (2 conditions x 2 biological replicates). b, Cumulative distribution log2FoldChange of translational efficiency between WT and Ythdf1−/− Flt3L-DCs. P values were calculated by two-sided Kolmogorov-Smirnov test; n = 2 independent biological replicates. Box-plot elements: centre line, median; box limits, upper and lower quartiles; whiskers, 1–99%. c, Metagene-plot depicting nearly unchanged m6A peak distribution and similar consensus motifs in WT and Ythdf1−/− Flt3L-DCs. P values of consensus motifs were generated by HOMER31 with one-sided binomial test. d, KEGG enrichment analysis of genes with significant decreased translation efficiency and YTHDF1 binding sites in 3’UTR (n = 204). One-tail hypergeometric test was used to determine statistical significance of enrichment. e, Heatmap showing the translational efficiency of lysosome genes in WT and Ythdf1−/− Flt3L-DCs. n, numbers of genes or m6A peaks.

