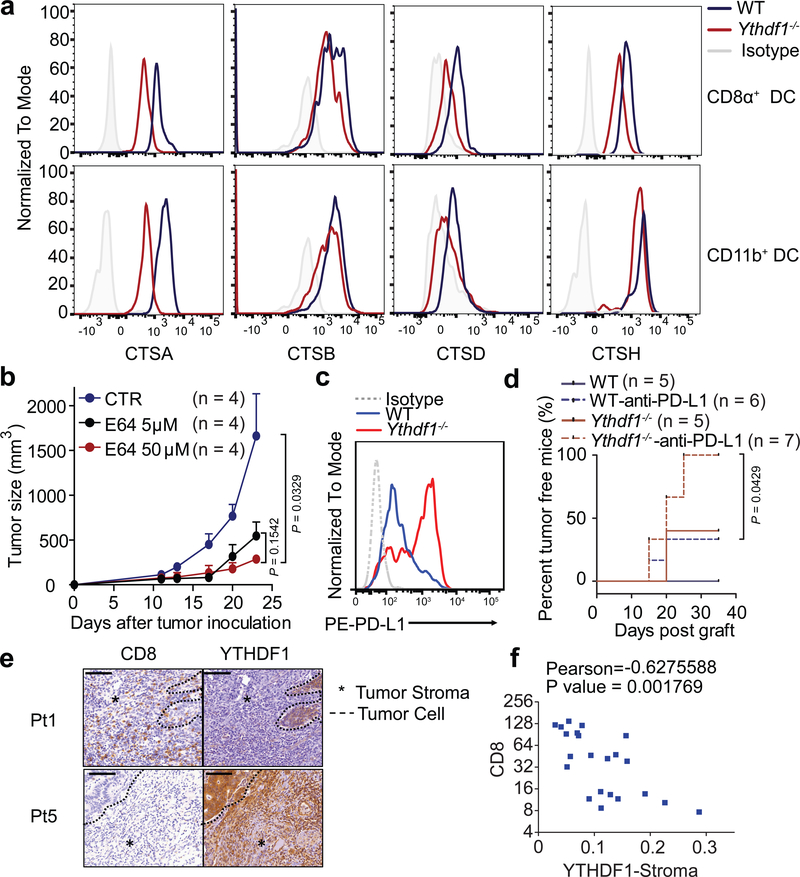
Figure 4 |. YTHDF1 promotes translation of proteases for excessive antigen degradation.
a, Representative histogram plots showing expressions of cathepsins on splenic CD8α+ and CD11b+ cDCs from WT and Ythdf1−/− mice. b, WT mice were injected s.c. with 106 B16-OVA cells. After 11 days, tumor-bearing mice were injected with DMSO as vehicle control (CTR) or E64 intratumorally (5 μM or 50 μM). Tumor growth was monitored over time. c, WT or Ythdf1−/− mice were injected s.c. with 106 B16-zsGreen-OT1 cells. The PDL1 expression on zsGreen+ tumor cells is shown. d, WT or Ythdf1−/− mice (n = 5/group) were injected s.c. with 106 B16-OVA cells. 200 μg of anti-PDL1 antibody were administered on day 8 and day 15. Percentage of mice with tumor regression were monitored over time and represented as percent tumor-free survival. (e-f) Tissue sections were characterized by immunohistochemical staining for CD8 and YTHDF1. Dash line delineates the edge of tumor area. Asterisk marks the stroma tissues. Representative YTHDF1 low (Patient 1) and YTHDF1 high (Patient 5) specimens are shown (e). Scale bars, 100 μm. f, Correlations between YTHDF1 in stroma area and CD8+ infiltrates are shown (n = 22 patients). Data are representative of two independent experiments with similar results (a, c); one of three representative images per tumor was shown (e). n, numbers of mice. Data are mean ± s.e.m. and were analyzed by two-tailed unpaired Student’s t-test (b, f) or two-tailed log-rank (Mantel-Cox) test (d).

