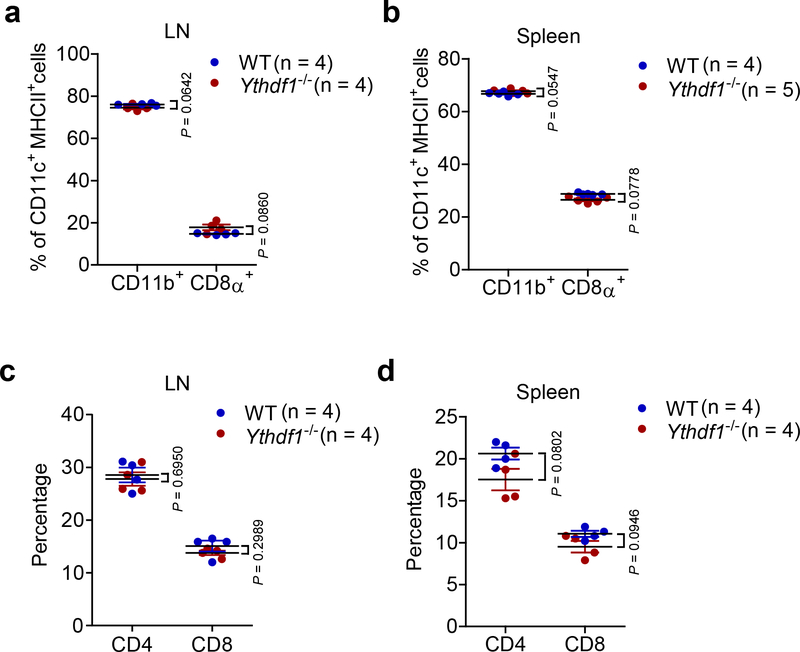
Extended Data Fig. 4 |. The development of DCs and T cells were similar in Ythdf1+/+ and Ythdf1−/− mice.
a-b, Percentages of CD11b+ and CD8α+ DCs in lymph node (LN) and spleen are shown. c-d, Percentages of CD4+ and CD8+ T cells in lymph node (LN) and spleen are shown. No significant difference was detected between WT and Ythdf1−/− mice. n, numbers of mice. Data are mean ± s.e.m. and were analyzed by two-tailed unpaired Student’s t-test.

