
Fig. 5.
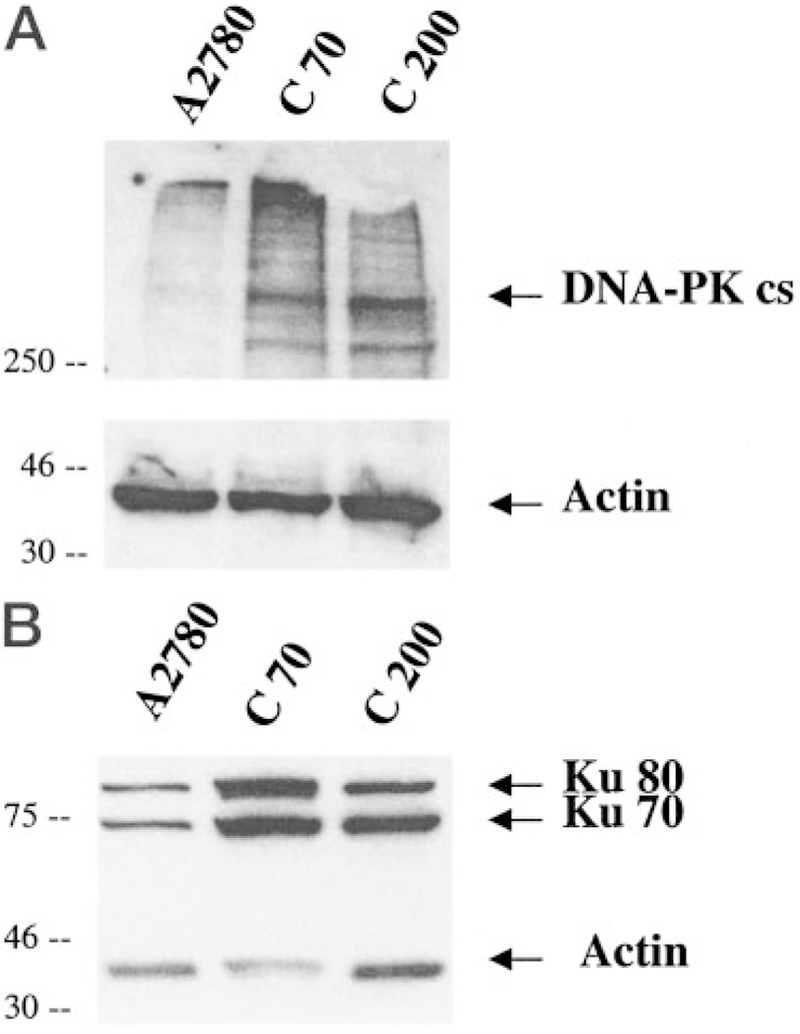
DNA-PKcs expression is elevated in cisplatin-resistant cell lines C70 and C200 compared with wild-type (A2780). DNA-PKcs (A), Ku 70 and Ku 80 (B) expression levels were determined by immunoblot analysis using 70 µg of protein from whole cell lysates. Densitometry was performed with NIH image analysis using actin as loading control. The blot is a representative example of three experiments.